
Fractions and Percentages Interactive Visualization
Loading the math board and drawing, please wait…
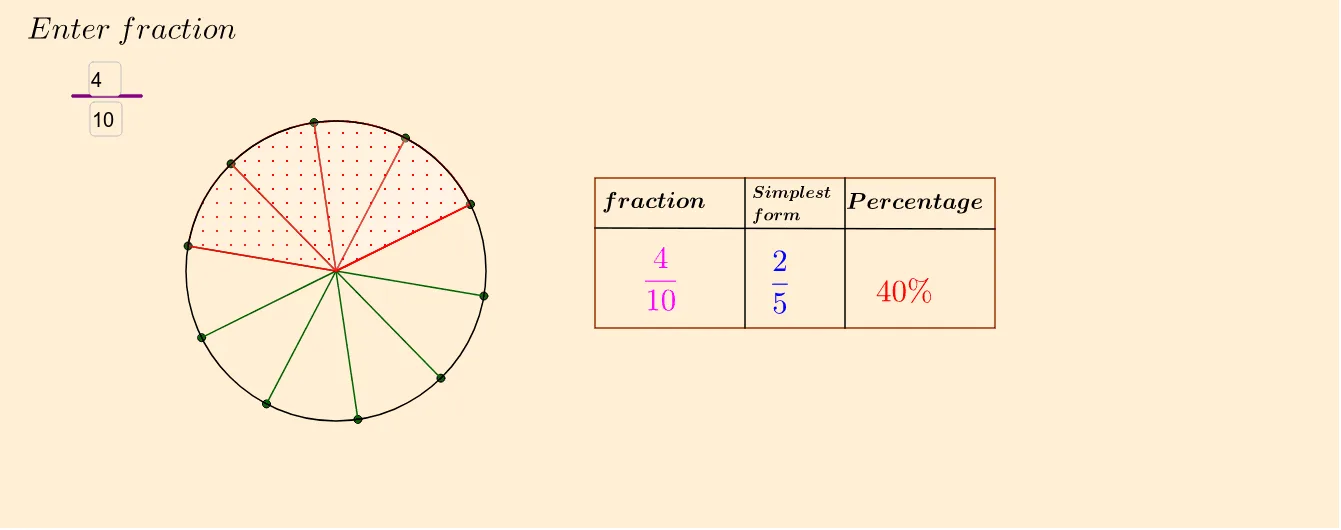
① This GeoGebra example dynamically visualizes the relationship between fractions and percentages using geometric shapes such as circles, segments, and polygons to represent proportional parts of a whole. ② Core mathematical concepts include the meaning of fractions, percentages, conversion between them, and understanding part-whole relationships through visual partitioning. ③ Construction highlights: commands like Circle, Point, Segment, Polygon, Sequence, Textfield, GCD, and InputBox are used to build interactive diagrams, with sliders and dynamic text updating values in real time. ④ Suitable for upper elementary to middle school students learning fractions and percentages, and useful for teachers demonstrating concepts or students exploring independently to build intuitive number sense.
GeoGebra Commands & Parameters
Circle(A, 3) → cPoint(c) → BSegment(A, B) → fSequence(Rotate[B, i°, A], i, 0, 360, 360 / denominator) → l1Sequence(Segment[A, Element[l1, t]], t, 1, denominator) → l2Sequence(CircleSector[A, B, Element[l1, r + 1]], r, 1, numerator) → l3Textfield(numerator) → numSegment(C, D) → gTextfield(denominator) → InputBox2GCD(numerator, denominator) → aPolygon(E, F, G, H) → q1, e, f_1, g_1, hPoint(h) → IPoint(f_1) → JSegment(I, J) → iPoint(e) → KPoint(g_1) → LSegment(K, L) → jPoint(e) → MPoint(g_1) → NSegment(M, N) → k
AI Drawing Prompt Reference
Draw a circle with a point on its circumference and a radius line from the center to that point. Divide the circle into equal parts according to the denominator value, drawing radial line segments from the center to each division point. Use circular sectors to represent the fraction, with the number of sectors matching the numerator value. Include interactive text input boxes for entering numerator and denominator values, displaying the corresponding fraction and percentage in real time. Add some auxiliary polygons and line segments around the main circle as visual guides. The entire visualization should update dynamically when the input values change.
The prompt above was compiled from the original drawing commands and is for reference only.