
Fraction Tape Diagrams
Loading the math board and drawing, please wait…
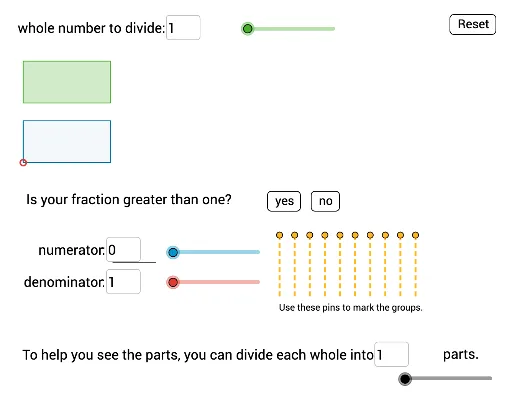
This example demonstrates fraction tape diagrams using GeoGebra, visually representing fractions and their comparisons. It involves core concepts like fractions, division, linear equations, and function graphs. Constructed with commands like Segment, Textfield, and Sequence, it's suitable for middle school mathematics teaching to understand fraction operations and function relationships.
GeoGebra Commands & Parameters
Segment(B_2, I) → f_1Segment(C_2, J) → g_1Segment(D, K) → h_1Segment(E, L) → i_1Segment(F, M) → jSegment(G, H) → kSegment(N, P) → lSegment(O, Q) → mTextfield(b) → bNumeratorTextfield(d) → dDenominatorSequence(Polygon[A + ((dist * (i - 1) / d), 0), A + ((dist * i / d), 0), A + ((dist * i / d), ht), A + ((dist * (i - 1) / d), ht)], i, 1, b) → ShadePartsSegment(R_1, S_1) → pTextfield(a) → aNumberTextfield(f) → fDivideWholeSegment(U, U + (0, -3)) → qSegment(V, V + (0, -3)) → rSequence(Polygon[B + ((dist * (i - 1) / f), 0), B + ((dist * (i - 1) / f), ht), B + ((dist * i / f), ht), B + ((dist * i / f), 0)], i, 1, (f * a)) → WholeSequence(Polygon[R + ((i * dist), 0), R + (((i + 1) * dist), 0), R + (((i + 1) * dist), ht), R + ((i * dist), ht)], i, 0, h - 1) → DivisorUnitsSequence(Polygon[S + ((dist * (i - 1) / d), 0), S + ((dist * (i - 1) / d), ht), S + ((dist * i / d), ht), S + ((dist * i / d), 0)], i, 1, (h * d)) → FracPartsSequence(T_1 + (((i * 0.17) * dist), 0), i, 1, 10) → list6