
Statistics App 2
Loading the math board and drawing, please wait…
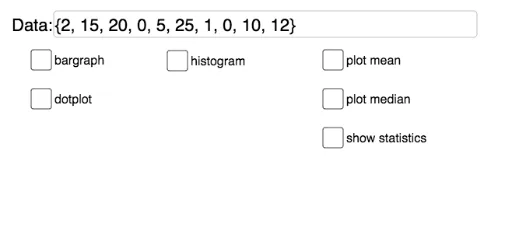
This example demonstrates the visualization and calculation of statistical data including histograms, means, medians, quartiles, and more. Core math concepts involve probability & statistics, integral (upper and lower sums), derivatives (tangent lines), and polynomial functions. It is constructed using GeoGebra commands like Textfield, Min, Max, Sequence, Mean, Median, Q1, Q3, Zip, DotPlot, Histogram, BoxPlot for data input, processing, and graphical display. Suitable for high school students and math enthusiasts learning data analysis and function properties.
GeoGebra Commands & Parameters
Textfield(data) → InputBox1_1Min(data) → mndMax(data) → mxdSequence(hmn + (i * spc), i, 0, hn) → list1Textfield(hmn) → InputBox2_1Textfield(hmx) → InputBox3_1Textfield(spc) → InputBox4_1Mean(data) → avgMedian(data) → mdnQ1(data) → dq1Q3(data) → dq3Zip(abs(z - avg), z, data) → list2Mean(list2) → madDotPlot(data) → list3Textfield(mxy) → InputBox5_1Histogram(list1, data, false) → cMax(Frequency[data]) → htBoxPlot(1, 0.5, data) → a
AI Drawing Prompt Reference
Create a statistical visualization with histograms, box plots, and dot plots to show data distribution. Label the minimum and maximum values of the data, and calculate the mean, median, first quartile, and third quartile. Mark the positions of the mean and quartiles, and compute the standard deviation of the data. The histogram represents the frequency distribution of the data, the box plot displays the median and quartile ranges, and the dot plot shows individual data points.
The prompt above was compiled from the original drawing commands and is for reference only.