
Fraction Multiplication-3
Loading the math board and drawing, please wait…
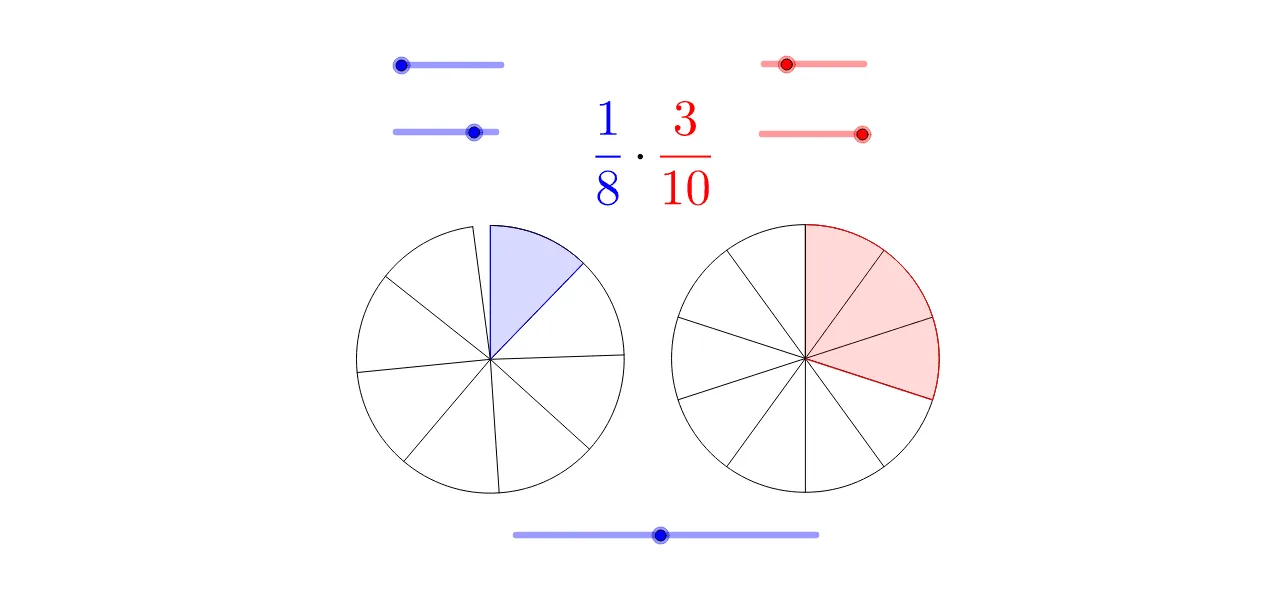
This example visually demonstrates the process of fraction multiplication through geometric shapes, helping students understand the meaning of fraction multiplication. Key mathematical concepts include fraction multiplication, geometric construction, and coordinate geometry. Using GeoGebra commands such as Max, Min, If, and Sequence, students can dynamically observe changes in fraction multiplication.
GeoGebra Commands & Parameters
Max(0, abs(t) - 5) → ntMin(nt, 100) → t1Max(0, nt - 100) → t2If(b, BA, AA) → CIf(b, 1, (den1 - (ts * (den1 - en1))) / den1) → f1Sequence(Segment[B, Rotate[B1, ((((-f1) * 2) * π) * i / den2), B]], i, 0, den2 - 1) → list2CircleArc(B, Rotate[B1, (((-2) * π) * f1), B], B1) → fSegment(B, Rotate[B1, (((-2) * π) * f1), B]) → aCircleSector(B, Rotate[B1, ((((-f1) * 2) * π) * en2 / den2), B], B1) → dSequence(Segment[C, Rotate[C1, ((2 * π) * i / den3), C]], i, 1, den3 - 1) → list3If(b, (den2 - (ts * (den2 - en2))) / den2, 1) → f2CircleSector(A, Rotate[A1, ((((-f2) * 2) * π) * en1 / den1), A], A1) → cSequence(Segment[A, Rotate[A1, ((((-f2) * 2) * π) * i / den1), A]], i, 0, den1 - 1) → list1CircleArc(A, Rotate[A1, (((-2) * π) * f2), A], A1) → eSegment(A, Rotate[A1, (((-2) * π) * f2), A]) → g
AI Drawing Prompt Reference
Draw a geometric figure demonstrating fraction multiplication. Create two circles, each centered at a distinct point, divided into equal sectors by radial segments from the center to the circumference. In each circle, shade or outline a sector or arc representing a fraction of the whole, using different colors. Connect the two circles with a line segment to indicate multiplication. The figure should visually show how the overlapping or corresponding parts of the two circles illustrate the product of the fractions.
The prompt above was compiled from the original drawing commands and is for reference only.