
Fraction and Decimal Hundredths Grids
Loading the math board and drawing, please wait…
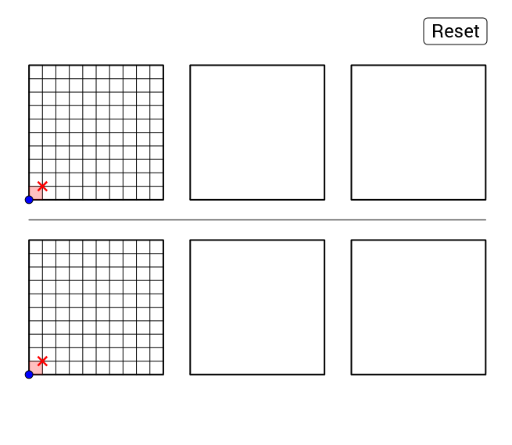
This example demonstrates the visual representation of fractions and hundredths using grids. It involves core math concepts like fractions, decimals, percentage conversion, and grid visualization. Construction highlights include using GeoGebra commands such as Sequence, Point, If, Polygon, Text, and Segment. Suitable for middle school and above, it helps students understand the geometric meaning and conversion between decimals and fractions.
GeoGebra Commands & Parameters
Sequence((i - 1 + floor((i - 1) / 11), -13), i, 1, 33) → Q10listPoint(Q10list) → Q10Sequence((x(Q10) + 1, i), i, -13, -3) → Q100listPoint(Q100list) → Q100If(y(Q100) ≟ -3, 1, 0) → carry2HIf(y(Q100) ≟ -3 ∧ (x(Q10) ≟ 9 ∨ x(Q10) ≟ 21 ∨ x(Q10) ≟ 33), 1, 0) → carry2DIf(x(Q10) < 10, 0, If[x(Q10) < 22, 1, If[x(Q10) < 34, 2, 3]]) → du2Sequence((i - 1 + floor((i - 1) / 11), 0), i, 1, 33) → P10listPoint(P10list) → P10Sequence((x(P10) + 1, i), i, 0, 10) → P100listPoint(P100list) → P100If(y(P100) ≟ 10 ∧ (x(P10) ≟ 9 ∨ x(P10) ≟ 21 ∨ x(P10) ≟ 33), 1, 0) → carry1DIf(x(P10) < 10, 0, If[x(P10) < 22, 1, If[x(P10) < 34, 2, 3]]) → du1If(y(P100) ≟ 10, 1, 0) → carry1HPolygon((0, 0), (10, 0), 4) → Square1Polygon((12, 0), (22, 0), 4) → Square2Polygon((24, 0), (34, 0), 4) → Square3Sequence(Segment[(0, i), (10, i)], i, 1, 9) → h1Sequence(Segment[(i, 0), (i, 10)], i, 1, 9) → v1Sequence(Segment[(12, i), (22, i)], i, 1, 9) → h2Sequence(Segment[(24, i), (34, i)], i, 1, 9) → h3Sequence(Segment[(i + 12, 0), (i + 12, 10)], i, 1, 9) → v2Polygon(((12 * digitunit), 0), ((12 * digitunit), 10), ((12 * digitunit) + digit10th, 10), ((12 * digitunit) + digit10th, 0)) → poly10th, a, b, c, dSequence(Segment[(i + 24, 0), (i + 24, 10)], i, 1, 9) → v3Polygon(P10, P10 + (1, 0), P100, P100 - (1, 0)) → poly100th, e, f, g, hPolygon((0, 0), (10, 0), 4) → ColorSquare1Polygon((12, 0), (22, 0), 4) → ColorSquare2Polygon((24, 0), (34, 0), 4) → ColorSquare3Text(Element[List1, digitunit + 1]) → text16Text(("點" * Element[List1, digit10th + 1])) → text17Text(Element[List1, digit100th + 1]) → text18Polygon((0, -13), (10, -13), 4) → Square4Polygon((12, -13), (22, -13), 4) → Square5Polygon((24, -13), (34, -13), 4) → Square6Polygon((0, -13), (10, -13), 4) → ColorSquare4Polygon(((12 * digitunit2), -3), ((12 * digitunit2), -13), ((12 * digitunit2) + digit10th2, -13), ((12 * digitunit2) + digit10th2, -3)) → poly10th2, i, j, k, lPolygon((12, -13), (22, -13), 4) → ColorSquare5Polygon((24, -13), (34, -13), 4) → ColorSquare6Polygon(Q10, Q10 + (1, 0), Q100, Q100 - (1, 0)) → poly100th2, q10, m, q100, nText(Element[List1, digitunit2 + 1]) → text31Text(("點" * Element[List1, digit10th2 + 1])) → text32Text(Element[List1, digit100th2 + 1]) → text33Segment(M, M + (L, 0)) → qSegment(M + (L, 0), M + (L, H)) → rSegment(M + (L, H), M + (0, H)) → sSegment(M, M + (0, H)) → tSegment(N, N + (L, 0)) → a_1Segment(N + (L, 0), N + (L, H)) → b_1Segment(N + (L, H), N + (0, H)) → c_1Segment(N, N + (0, H)) → d_1Segment((0, -1.5), (34, -1.5)) → pSequence(Segment[(i, -13), (i, -3)], i, 1, 9) → v4Sequence(Segment[(i + 12, -13), (i + 12, -3)], i, 1, 9) → v5Sequence(Segment[(i + 24, -13), (i + 24, -3)], i, 1, 9) → v6Sequence(Segment[(0, i), (10, i)], i, -12, -4) → h4Sequence(Segment[(12, i), (22, i)], i, -12, -4) → h5Sequence(Segment[(24, i), (34, i)], i, -12, -4) → h6Polygon(B, C, D, E) → poly1, b_2, c_2, d_2, e_1
AI Drawing Prompt Reference
Draw a hundredths grid with three 10x10 small grids and three 100x1 small grids. Each small grid is labeled with fractions and decimals using points and segments. In each small grid, points represent the positions of fractions and decimals, and lines connect these points. Draw grid lines at the top and bottom of each small grid, and use different colors to distinguish the grids.
The prompt above was compiled from the original drawing commands and is for reference only.