
Formal Definition of Vertical Asymptotes
Loading the math board and drawing, please wait…
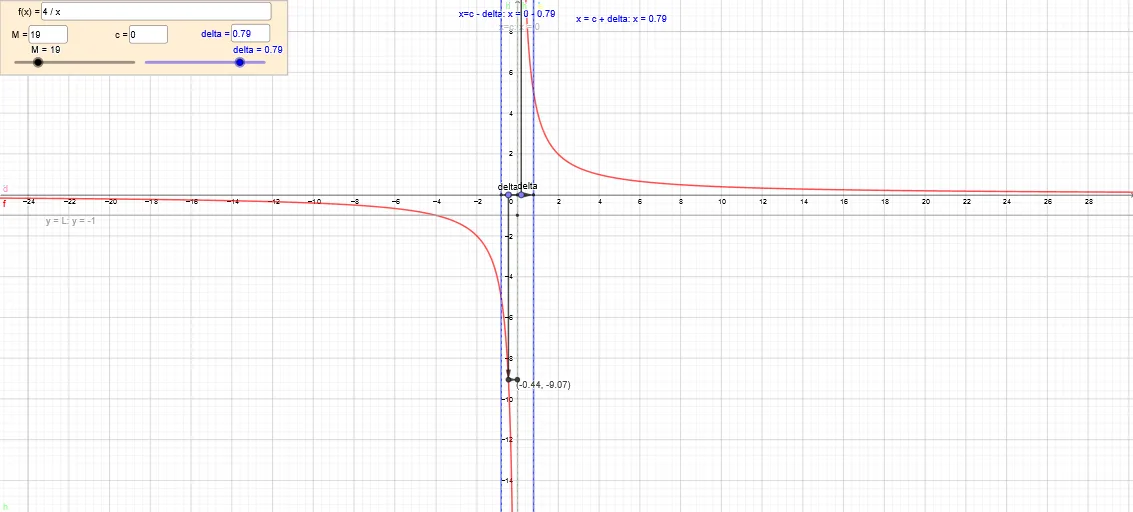
This example demonstrates the formal definition of infinite limits, specifically vertical asymptotes. It constructs the limit of a function f(x) as x approaches x0, showing that the function values tend to infinity. GeoGebra commands used include Vector, Segment, Intersect, etc. Suitable for high school math education to help students understand the concept of limits.
GeoGebra Commands & Parameters
Textfield(f) → InputBox1Textfield(delta) → InputBox5Intersect(eq1, xAxis) → HIntersect(eq2, xAxis) → IIntersect(q, xAxis) → JVector(H, I) → wVector(H, J) → aSegment(I, J) → iTextfield(c) → InputBox2Point(a) → QOrthogonalLine(Q, xAxis) → mIntersect(f, m, (0.1897318290026606, 21.082387815614783)) → RIntersect(f, m, (0.1897318290026606, 21.082387815614783)) → SOrthogonalLine(R, yAxis) → rIntersect(r, yAxis) → TVector(Q, R) → sVector(R, T) → tPoint(w) → UOrthogonalLine(U, xAxis) → nIntersect(f, n, (-0.44117329729478644, -9.066731881842001)) → VOrthogonalLine(V, yAxis) → h_1Intersect(h_1, yAxis) → WVector(U, V) → u_1Vector(V, W) → v_1Textfield(M) → InputBox3
AI Drawing Prompt Reference
Draw a function graph to illustrate its vertical asymptote. First, mark the intersection points of the function with the x-axis, then draw vectors connecting these points. Next, draw perpendicular lines from the vector's starting point to the function graph, intersecting at two points. From these points, draw vertical lines to the y-axis and mark their intersections. Finally, draw vectors connecting these points and label relevant elements to clearly demonstrate the definition of vertical asymptotes and the concept of infinite limits.
The prompt above was compiled from the original drawing commands and is for reference only.