
Fisher's Exact Test Two - Modified with Added Statistics
Loading the math board and drawing, please wait…
In collections
Complex Math
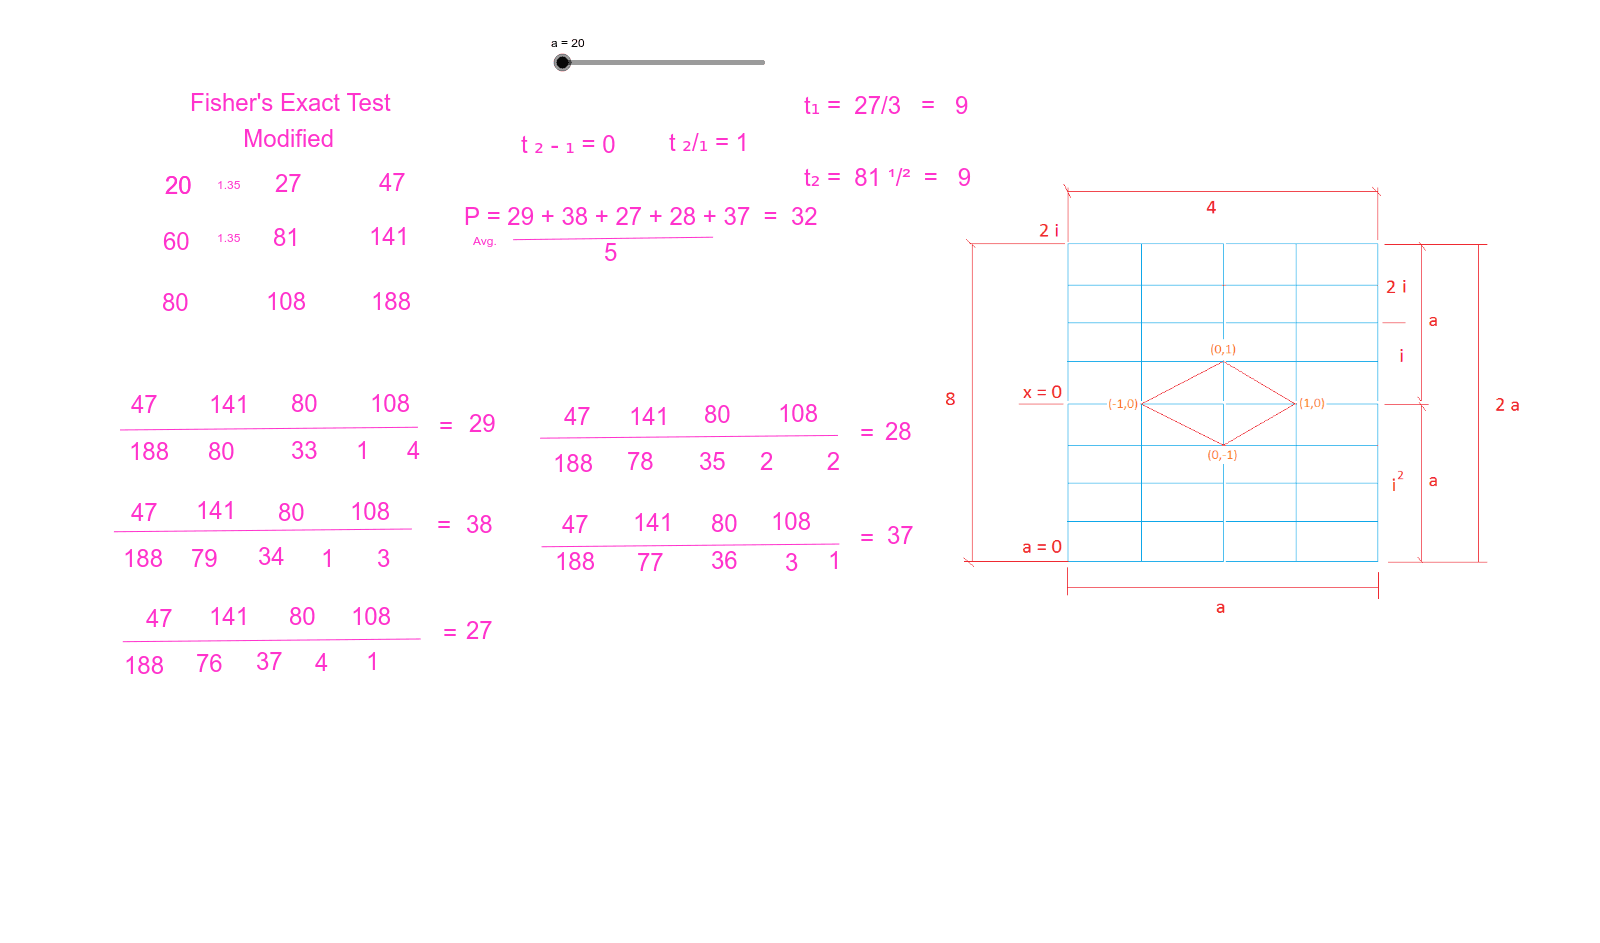
This GeoGebra example demonstrates an interactive visualization of Fisher's exact test for 2x2 contingency tables, showing how exact p-values are computed under fixed marginal totals using the hypergeometric distribution. The core mathematical concept is conditional inference and the hypergeometric probability model, where the sum of probabilities of tables as extreme or more extreme than observed determines statistical significance. The construction uses Segment commands to draw the table grid and auxiliary lines, along with numerous text objects (text1 through text22) to display observed frequencies, row/column margins, expected counts, and p-values. Users can modify cell values via sliders or input fields to see real-time updates. This resource is suitable for high school and undergraduate statistics courses, providing an intuitive tool for teaching hypothesis testing, contingency table analysis, and exact probability calculations.
GeoGebra Commands & Parameters
Segment(A, B) → qSegment(A_1, B_1) → q_1Segment(A_2, B_2) → q_2Segment(A_3, B_3) → q_3Segment(A_4, B_4) → q_4Segment(K, L) → j_1
AI Drawing Prompt Reference
Create an interactive visualization of Fisher's exact test for a 2x2 contingency table. The graphic should feature a table grid made of segments forming four cells, with auxiliary lines to separate rows and columns. Place multiple text elements to display observed frequencies, marginal totals, expected counts, and the exact p-value. Include sliders or input fields for users to modify cell values, enabling real-time updates of the data and statistics. Start by drawing the grid and auxiliary lines, then add text annotations and interactive controls.
The prompt above was compiled from the original drawing commands and is for reference only.