
Fermi Distribution Demo
Loading the math board and drawing, please wait…
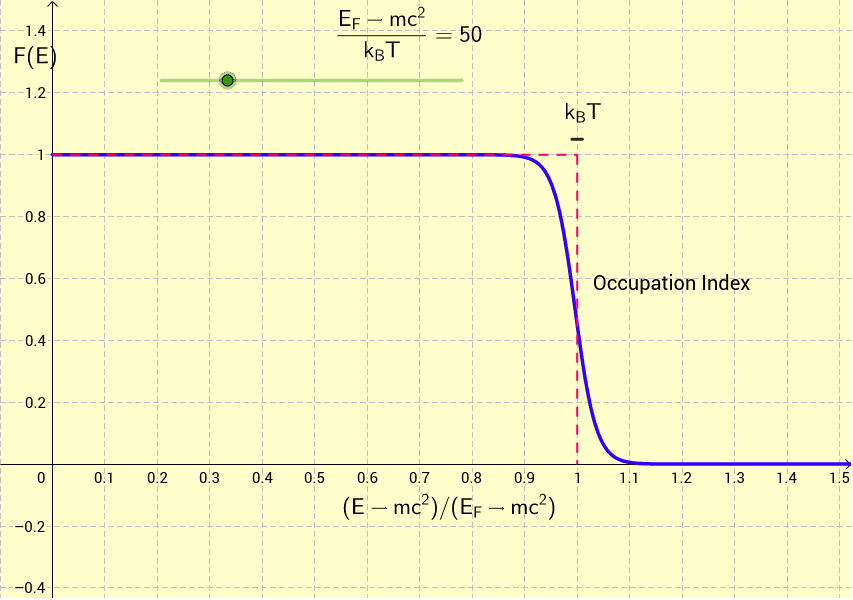
This example demonstrates how the Fermi distribution varies with the degeneracy parameter, involving core math concepts like Fermi distribution, degeneracy parameter, and probability & statistics. It is constructed using GeoGebra commands/objects like If, Point, Segment, targeting university students and researchers in physics and astrophysics.
GeoGebra Commands & Parameters
If(x > 0, 1 / (exp(XF * x - XF + 9.87 / XF) + 1)) → fPoint(yAxis) → ASegment(A, B) → aPoint(xAxis) → CSegment(B, C) → bIf(1 - 1 / (2XF) < x < 1 + 1 / (2XF), 1.05) → kTPoint(kT) → EPoint(f) → D
AI Drawing Prompt Reference
Draw a graph showing how the Fermi distribution varies with the degeneracy parameter, including a curve representing the Fermi distribution, a line segment connecting a point on the x-axis to the Fermi distribution curve, a point on the x-axis, and a point above the Fermi distribution curve, connected by a line segment. Also, add a fixed-height point above the Fermi distribution curve to represent temperature.
The prompt above was compiled from the original drawing commands and is for reference only.