
Exponential Functions: Dynamic Exploration of Parameter Effects
Loading the math board and drawing, please wait…
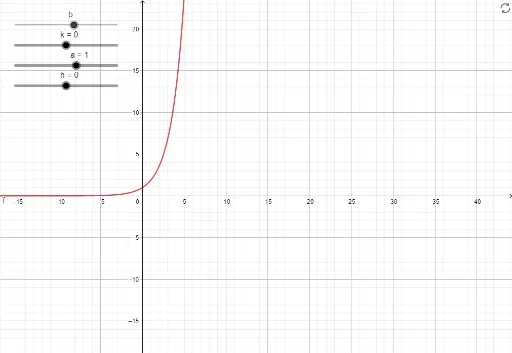
This example demonstrates how the graph of an exponential function changes as parameters vary, using sliders to adjust base, coefficient, and horizontal shift. It visually illustrates the fundamental shape, monotonicity, and asymptote behavior of exponential functions, along with geometric transformations such as translation and scaling. The construction uses GeoGebra sliders for parameters k, b, a, and h, and defines the function f, allowing real-time observation of graph changes. Core concepts include exponential growth/decay, transformations, and function equations. Suitable for high school and early college students learning exponential functions, as well as for classroom demonstrations or self-study to build intuition about parameter-graph relationships.
GeoGebra Commands & Parameters
Numeric k(0)Numeric b(1.89)Numeric a(1)Numeric h(0)f(x) = (a * b^(x + h)) + k
AI Drawing Prompt Reference
Create a dynamic visualization of an exponential function graph. The scene includes a coordinate plane with a single exponential curve whose shape and position change based on adjustable parameters. Four sliders are present, controlling the base value, vertical shift, vertical stretch, and horizontal shift. As the sliders move, the curve updates in real time, showing growth or decay, a horizontal asymptote, and the current function equation. The layout is clean and educational, suitable for classroom demonstration.
The prompt above was compiled from the original drawing commands and is for reference only.