
Exponential Functions Analysis
Loading the math board and drawing, please wait…
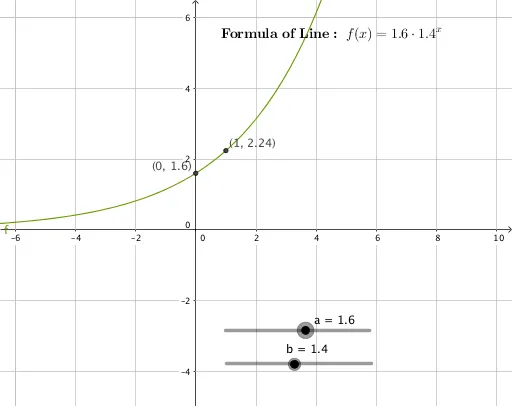
This example demonstrates the characteristics of exponential functions. It covers key mathematical concepts such as the definition, graph features, and basic properties of exponential functions. Using GeoGebra commands like `b`, `a`, `f`, etc., you can dynamically adjust parameters to observe function changes. Suitable for high school math education and learning.
GeoGebra Commands & Parameters
Numeric b(1.4)Numeric a(1.6)f(x) = (a * b^(x))(10.5, 6.5)(-6.5, -5)(0, f(0))(1, f(1))
AI Drawing Prompt Reference
Draw a graph of an exponential function with a base of approximately 1.4 and a coefficient of approximately 1.6, defined as the coefficient times the base raised to the power of x. The graph should be displayed on a coordinate plane with the x-axis ranging roughly from -6.5 to 10.5 and the y-axis from -5 to 6.5. Mark two key points on the curve: one at x=0 and another at x=1, showing their corresponding y-values. The curve should be monotonically increasing, approaching the x-axis on the left without touching it, and rising to the upper right. The overall shape should clearly illustrate exponential growth, suitable for high school mathematics instruction.
The prompt above was compiled from the original drawing commands and is for reference only.