
Sequence Plotter with Partial Sums
Loading the math board and drawing, please wait…
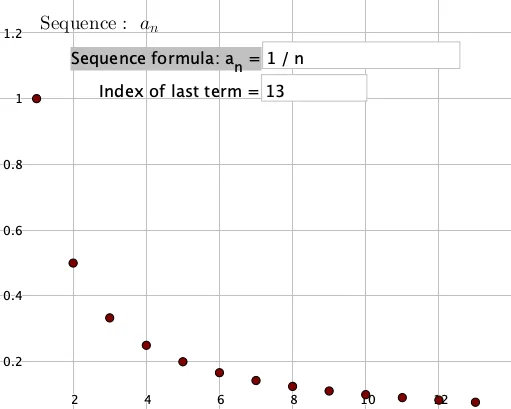
This GeoGebra example visualizes the terms of a sequence and the corresponding sequence of partial sums simultaneously, allowing users to observe how partial sums accumulate and approach a limit. It covers core mathematical concepts such as sequences, partial sums, limits, and introductory series. The construction uses the Sequence command to generate both the sequence terms and partial sums, Min and Max commands to auto-scale the axes, and Textfield/InputBox objects for interactive input of the general term and number of terms. Key objects include A, b, L_1, L_2, L_3, Lower, Upper, and text labels. This tool is suitable for high school and early college students learning sequences and series, and serves as a visual aid for understanding infinite series in calculus.
GeoGebra Commands & Parameters
Sequence((n, A(n)), n, 1, b) → L_1Min(A, 1, b) → YMinTextfield(A) → InputBox1Textfield(b) → InputBox2Sequence((k, Sum[A(n), n, 1, k]), k, 1, b) → L_2Max(y(L_2)) → L_3