
Exponential Function Transformations by GreenMaths
Loading the math board and drawing, please wait…
In collections
Transforming Functions
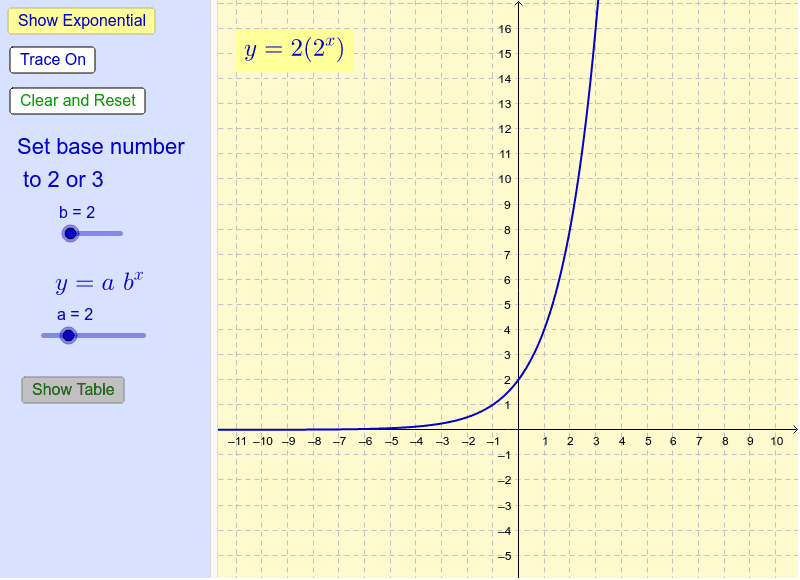
This example demonstrates the effects of changing the coefficient in front of exponential functions with bases 2 or 3. It involves core math concepts like exponential function properties and the impact of coefficients on graphs. Constructed using sliders to control coefficient 'a' and dynamically display the graph changes of y=a^x, with TableText for data visualization. Suitable for high school students to understand transformation rules of exponential function graphs.
GeoGebra Commands & Parameters
TableText({{A1, B1, C1}, {A2, B2, C2}, {A3, B3, C3}, {A4, B4, C4}, {A5, B5, C5}, {A6, B6, C6}, {A7, B7, C7}, {A8, B8, C8}}, "c_|") → text3