
Exponential Function of e Visualization
Loading the math board and drawing, please wait…
In collections
Geom. & Alg.: Exponential Functions & Logarithms
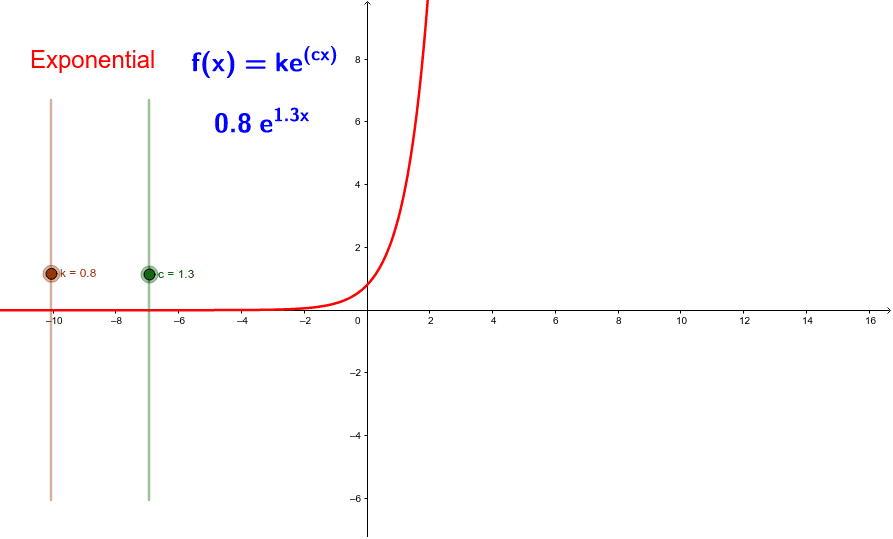
This example demonstrates the graph of the exponential function e^x and its properties. Key math concepts include exponential functions, derivatives, tangent lines, and 3D surfaces. It uses GeoGebra's LaTeX commands, sliders, and text objects to dynamically show the function graph and parameter changes. Suitable for high school students and teachers to understand the geometric meaning and calculus applications of exponential functions.
GeoGebra Commands & Parameters
LaTeX(f) → text1
AI Drawing Prompt Reference
Graph the exponential function e^x, showing its derivative and tangent lines, while including 3D surfaces to illustrate its geometric properties and calculus applications. Use LaTeX to display the function expression and sliders to dynamically adjust parameters, showing the effect of parameter changes on the graph.
The prompt above was compiled from the original drawing commands and is for reference only.