
Exponential Function Graphs by KS Wong
Loading the math board and drawing, please wait…
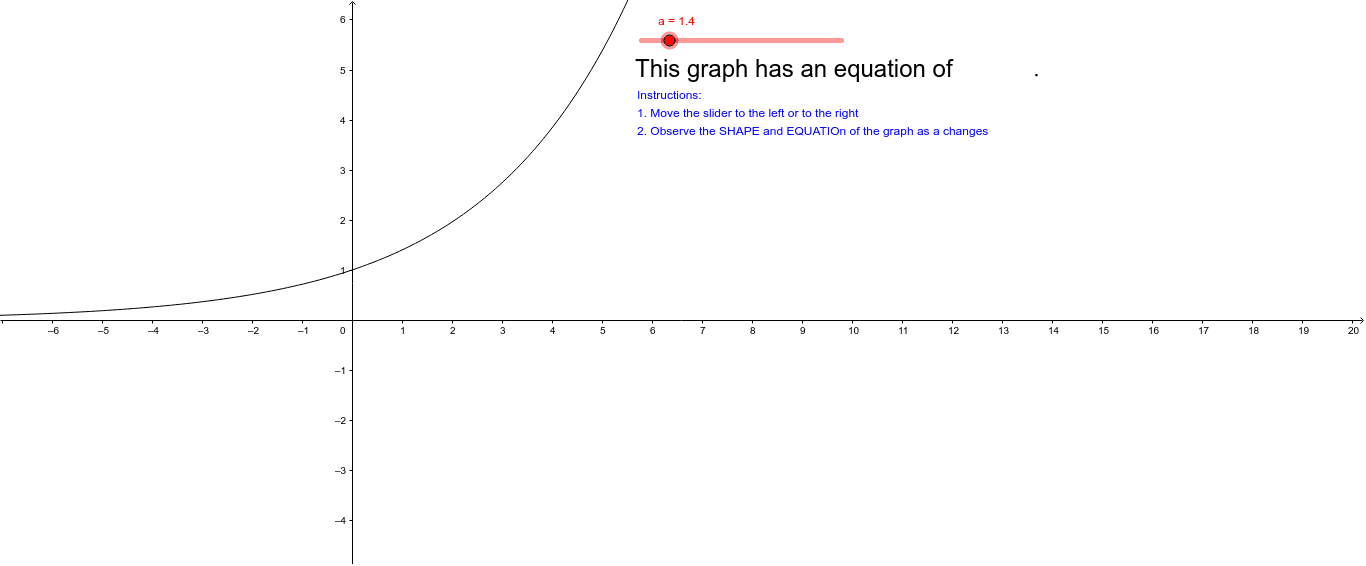
This example demonstrates the graphs of exponential functions. It involves key mathematical concepts such as the properties and characteristics of exponential functions. Using GeoGebra commands, the graph of an exponential function can be constructed and its dynamic effects observed as parameters change. Suitable for high school mathematics education and learning.
GeoGebra Commands & Parameters
Numeric a(1.4)c(x) = a^(x)
AI Drawing Prompt Reference
Draw the graph of an exponential function, showing the dynamic effect of the function's shape as the base parameter changes, with the key being the setting of the base parameter and its influence on the function's graph, first determine a value for the base parameter, then draw the graph of the exponential function based on this value, and observe the dynamic effect of parameter changes on the graph's shape.
The prompt above was compiled from the original drawing commands and is for reference only.