
Power Function Graph y=ax^0
Loading the math board and drawing, please wait…
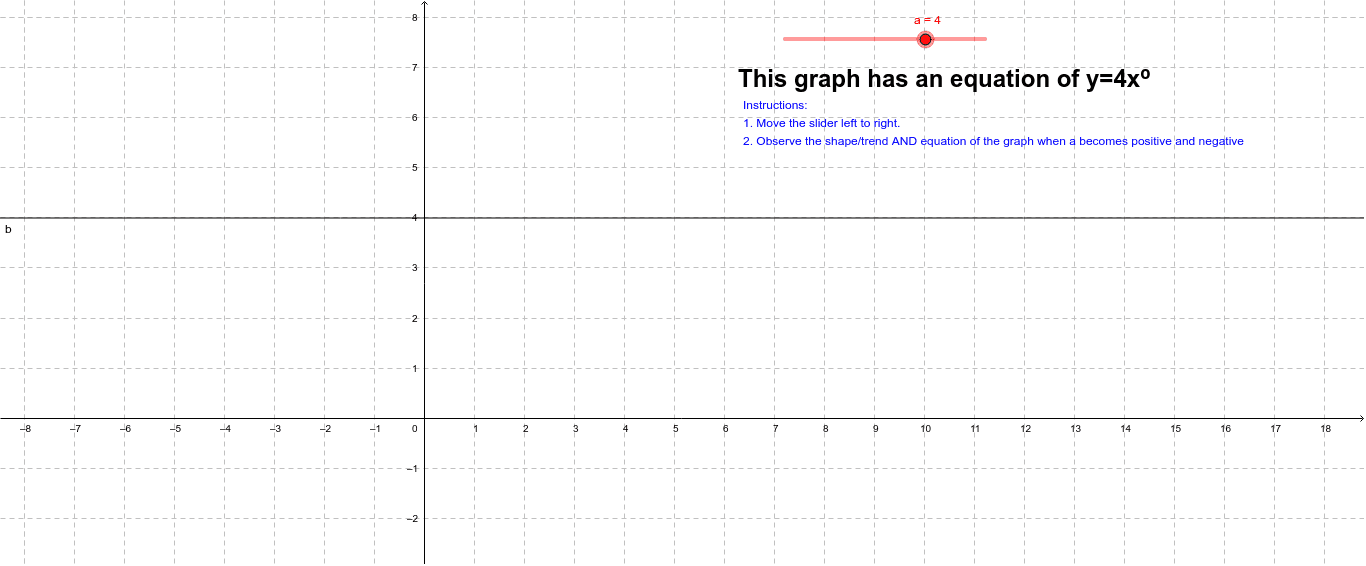
This example demonstrates the graph of the power function y=ax^0, illustrating how the function behaves as the parameter 'a' changes. Key math concepts include power functions, exponent rules (a^0=1), and graph transformations. The construction uses GeoGebra objects like sliders (a), text elements (text2, text1), and variables (b) to visualize the function's behavior. Suitable for high school mathematics education to explore power function properties and exponent operations.
GeoGebra Commands & Parameters
Numeric a(4.0)y = (a * x^(0))
AI Drawing Prompt Reference
Draw the graph of the power function y=ax^0 where the parameter a is controlled by a slider, showing how the function behaves as a changes. The key is to illustrate that when the exponent is 0, the function is always equal to 1, and how the parameter a affects the function's graph. Use a slider to adjust the value of a and display the function graph and the current value of a.
The prompt above was compiled from the original drawing commands and is for reference only.