
Exponential Function Graphing and Property Exploration
Loading the math board and drawing, please wait…
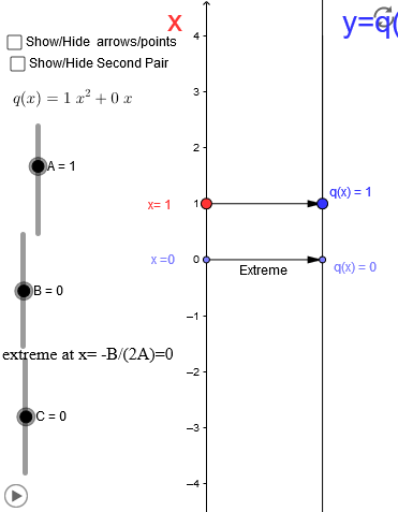
This example demonstrates how to graph exponential functions and explore their properties, involving core math concepts like exponential functions, correlation, curve sketching, and analytical geometry. It uses commands/objects such as Point, Vector, Textfield, Segment, Sequence in GeoGebra for creating points, vectors, texts, segments, and sequences. Suitable for high school students learning about exponential function graphing, property analysis, and parameter effects.
GeoGebra Commands & Parameters
Point(yAxis) → A_1Vector(A_1, B_1) → uTextfield(f) → inputBox1Vector(x_1, y_1) → vSegment(q_x, F) → cSegment(E, F) → dSegment(A_1, x_1) → eSegment(B_1, y_1) → gSegment(B_1, y_1) → h_1Sequence(Vector[(0, i), (2, f(i))], i, -3, 3, 1) → list1Sequence((i, f(i)), i, -3, 3, 1) → list2Vector(G, H) → Extreme
AI Drawing Prompt Reference
Draw an exponential function graph with point A on the y-axis, vector u through A, input box f for function expression, vectors v on the x-axis and y-axis, and a line segment sequence list1 based on points from list2 generated by the input function. Include vectors from the origin to v and line segments from list1 to form the function graph and key points.
The prompt above was compiled from the original drawing commands and is for reference only.