
Exponential Function Graph
Loading the math board and drawing, please wait…
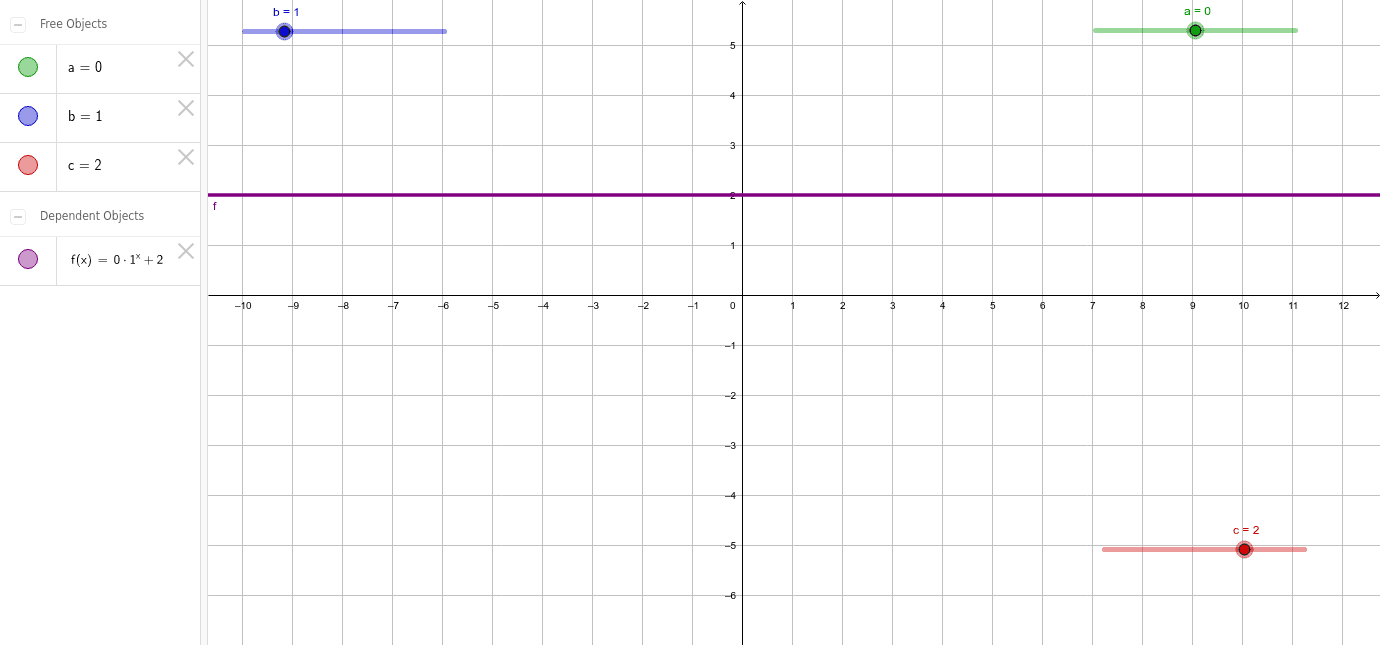
This example demonstrates the dynamic behavior of exponential functions through interactive sliders. Key mathematical concepts include exponential function definition, variable influence, and graph characteristics. Construction involves GeoGebra commands b, a, c, f to create function graphs. Suitable for high school mathematics teaching and graph analysis exercises.
GeoGebra Commands & Parameters
Numeric b(1.0)Numeric a(0.0)Numeric c(2.0)f(x) = (a * b^(x)) + c
AI Drawing Prompt Reference
Draw an interactive exponential function graph of the form f(x)=a·b^x+c with three sliders that adjust the parameters a, b, and c, initially set to 0, 1, and 2 respectively; dragging the sliders updates the curve in real time, showing vertical scaling, base changes, and vertical translation. The sliders allow continuous variation of each parameter, so the user can explore how the coefficient a stretches or compresses the graph vertically, how the base b controls the growth rate, and how the constant c shifts the curve up or down.
The prompt above was compiled from the original drawing commands and is for reference only.