
Graphing Linear Equations by William Voelker
Loading the math board and drawing, please wait…
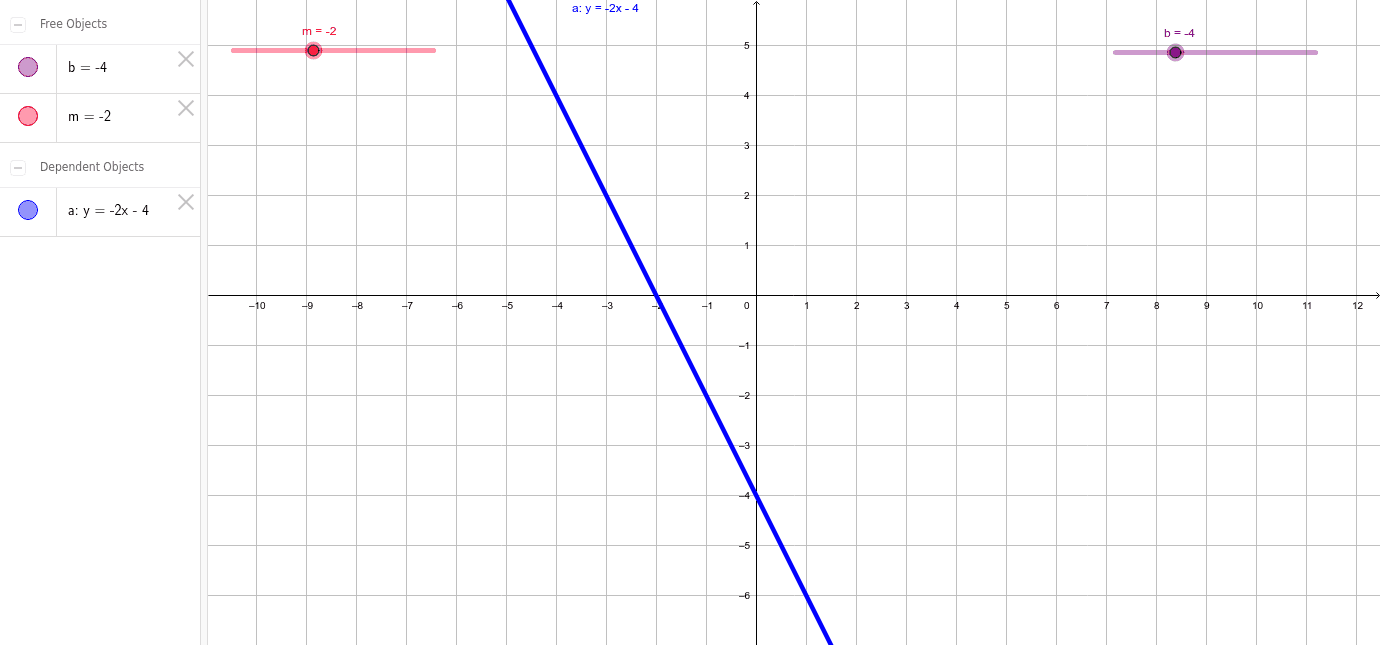
This example demonstrates how adjusting the slope 'm' and y-intercept 'b' affects the linear equation's graph. Core math concepts include linear equations, slope-intercept form (y=mx+b), and function graphing. It uses GeoGebra objects like sliders m and b, and variable a. Suitable for middle school students and introductory calculus learners to explore function graph transformations.
GeoGebra Commands & Parameters
Numeric m(-2.0)Numeric b(-4.0)y = (m * x) + b