
Exponential Curve y = a^-x
Loading the math board and drawing, please wait…
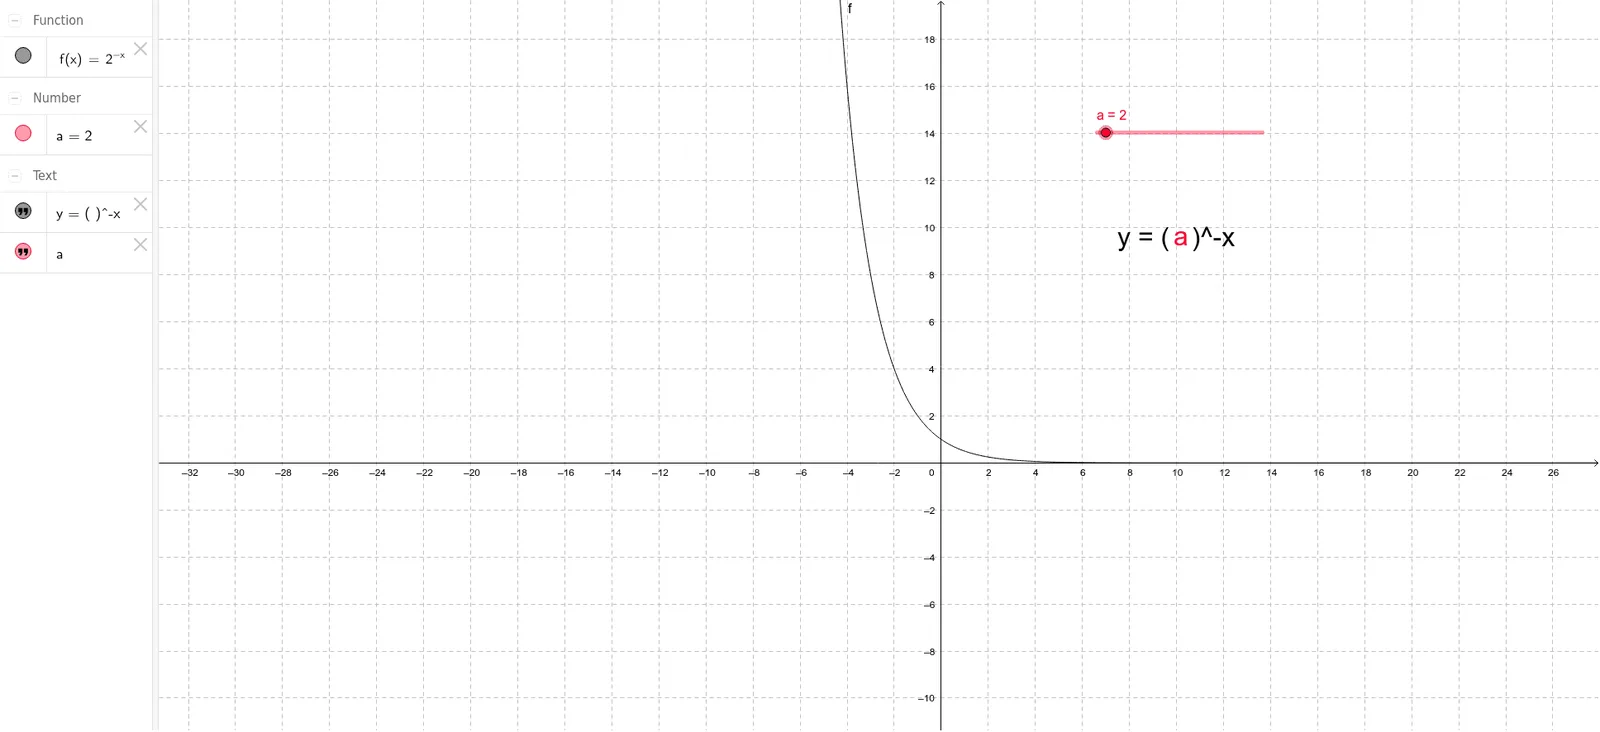
This example demonstrates the changes in the graph of the exponential function y = a^-x by adjusting the value of a using a slider. Key mathematical concepts include exponential functions. The construction involves using GeoGebra's slider animation feature and creating the function object f. Suitable for high school mathematics education and learning about the characteristics of exponential function graphs.
GeoGebra Commands & Parameters
Numeric a(2.0)f(x) = a^((-x))
AI Drawing Prompt Reference
Draw an exponential function graph y = a^-x with a as the base, where a is a slider. First, create a slider a with a value of 2.0, then create the function f(x) = a^(-x) using a, and observe how the graph changes as a varies.
The prompt above was compiled from the original drawing commands and is for reference only.