
Exponential Curve y = a^x with Slider
Loading the math board and drawing, please wait…
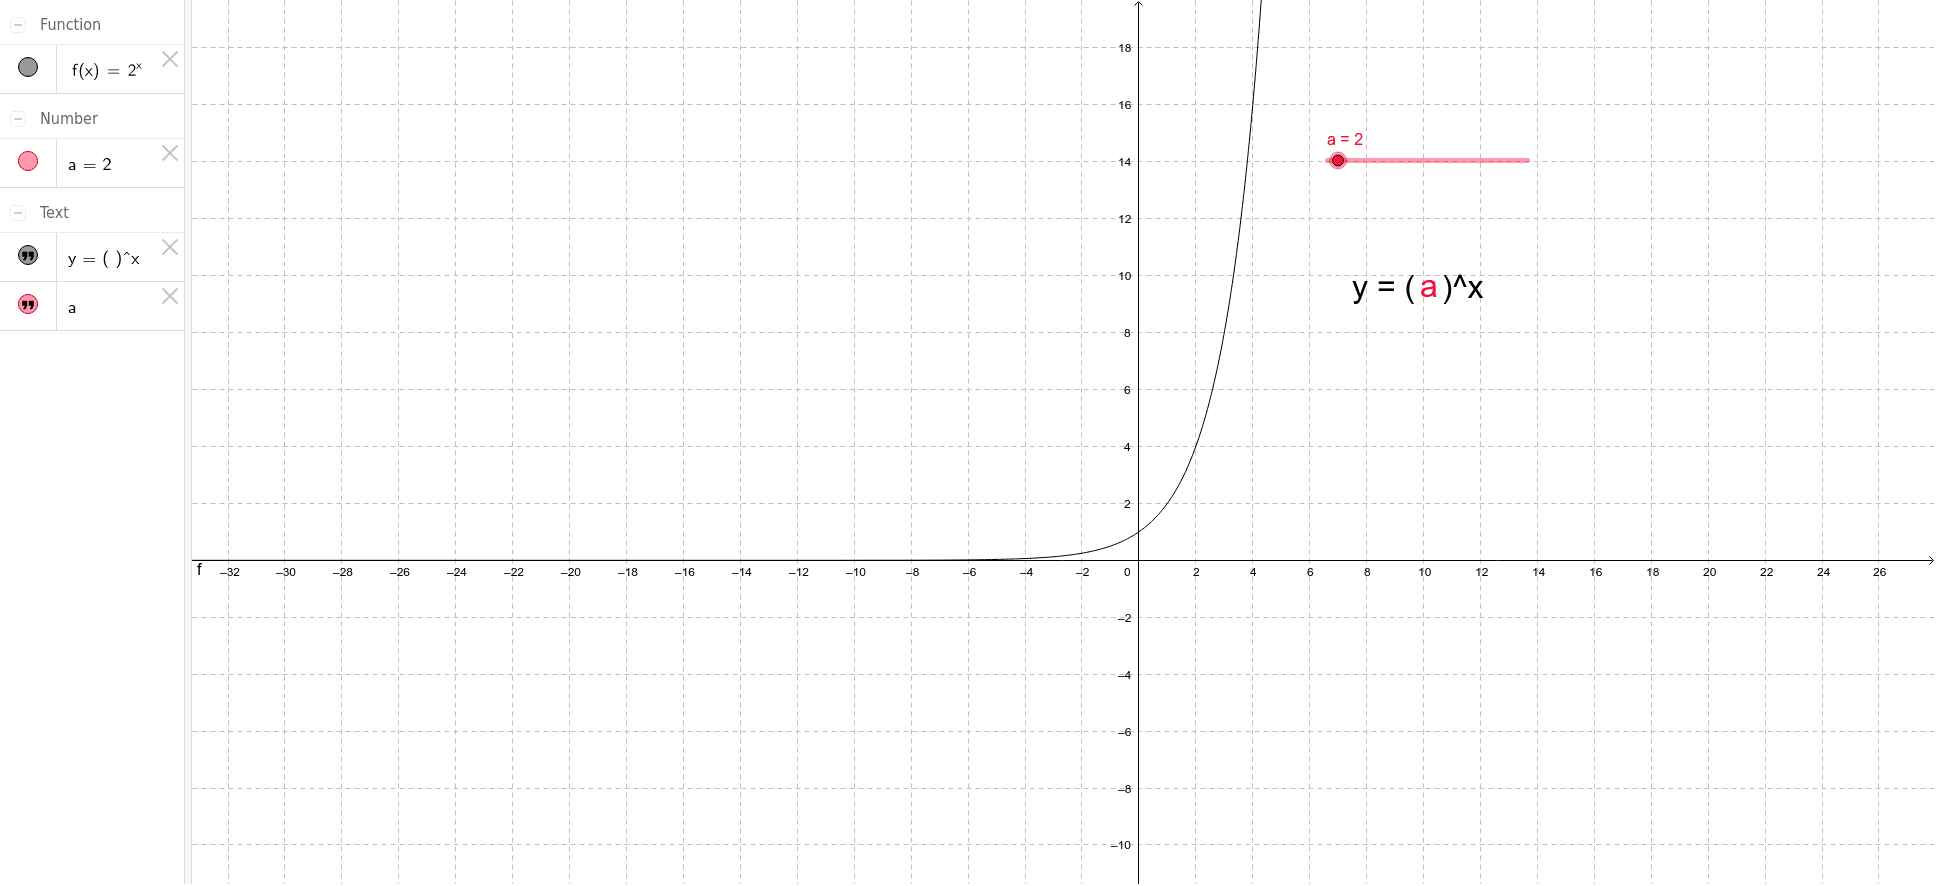
This interactive example lets users adjust the base a via a slider to see how the graph of the exponential function y = a^x changes in real time. It illustrates key concepts such as domain, range, monotonicity, and horizontal asymptotes of exponential functions. Construction uses a Slider for the parameter a, Text objects for labels, and the Function command to define and plot f(x)=a^x. Suitable for high‑school algebra or introductory calculus courses.
GeoGebra Commands & Parameters
Numeric a(2.0)f(x) = a^(x)
AI Drawing Prompt Reference
Create a slider to control the base a of an exponential function, starting at 2, then plot the curve y = a^x so it updates in real time as the slider moves; label the graph with its domain, range, monotonic behavior, and horizontal asymptote, and include a text note explaining that the slider adjusts the base, showing the transition between growth and decay.
The prompt above was compiled from the original drawing commands and is for reference only.