
Exponential and Logarithmic Functions by matheagle (2)
Loading the math board and drawing, please wait…
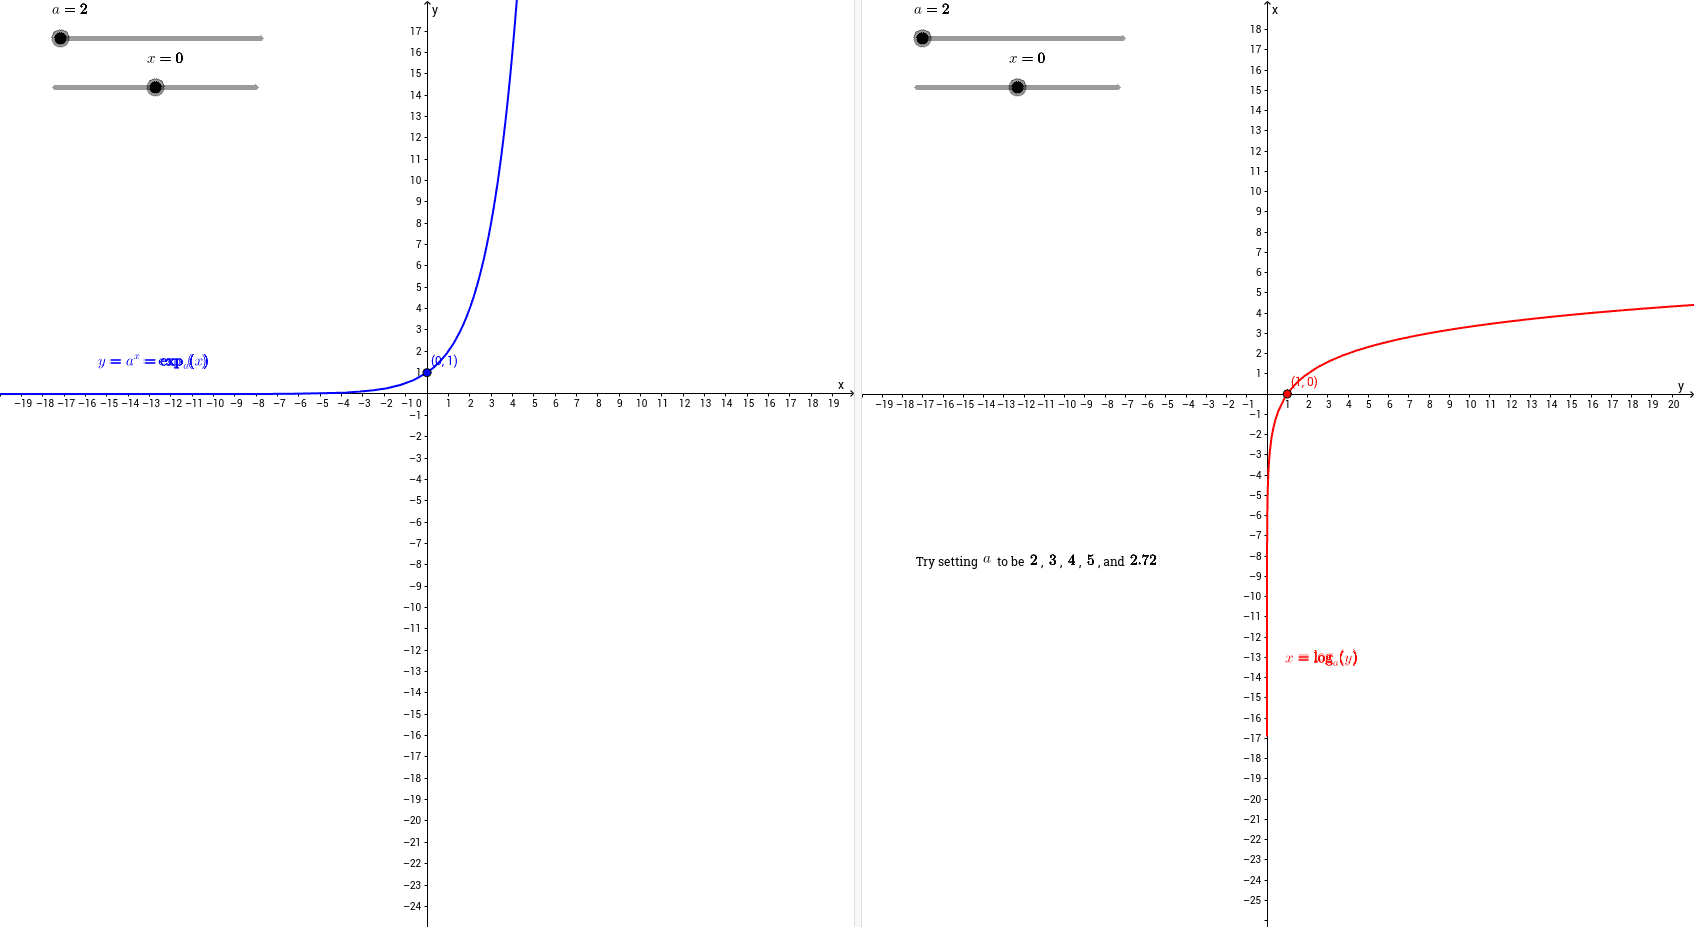
This example demonstrates the graphs and properties of exponential and logarithmic functions. It involves core math concepts like functions, exponential functions, logarithmic functions, and integral calculus concepts such as sums and limits. GeoGebra commands and objects used include a, b, f, g, A, B, text1, text1_1, text2 for defining variables, functions, points, and annotations. Suitable for high school students and educators for function graph analysis and calculus visualization.
GeoGebra Commands & Parameters
Numeric a(2.0)Numeric b(0.0)f(x) = a^(x)g(x) = log(a, x)(b, a^(b))(a^(b), b)
AI Drawing Prompt Reference
Draw the graphs of exponential and logarithmic functions. The exponential function is defined as a^x, and the logarithmic function as log_a(x). They intersect at the point (a^b, b). The graph should show the behavior of these functions on the x-axis and highlight the intersection point. Make sure the graph is clear and labels key points like (a, a) and (a^b, b).
The prompt above was compiled from the original drawing commands and is for reference only.