
Exponential and Logarithmic Functions by Ku, Yin Bon (Albert)
Loading the math board and drawing, please wait…
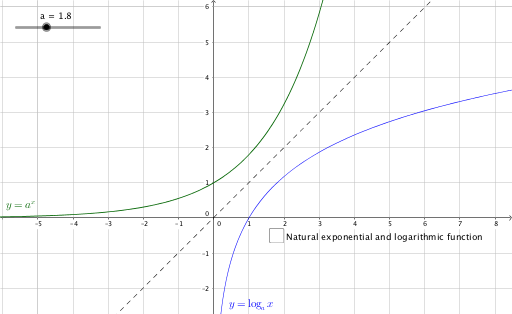
This GeoGebra example dynamically illustrates the graphs of exponential and logarithmic functions, which are inverses of each other, and their symmetry about the line y=x. It visually demonstrates how changing the base affects the shape and position of both curves. Core mathematical concepts include exponential functions, logarithmic functions, inverse functions, graph transformations, and the relationship between a function and its inverse. The construction uses objects a, f, g, h, b, k, and i, where a and b likely serve as base parameters (sliders), f and g represent the exponential and logarithmic functions respectively, h may be the line y=x, and k and i could be auxiliary points or tangents. By adjusting the base with sliders, learners can observe how the graphs change and confirm the mirror symmetry. This resource is suitable for high school students studying function properties and inverse functions, as well as for college preparatory review, and can be used for classroom demonstrations or self-directed exploration.
GeoGebra Commands & Parameters
Numeric a(1.8)f(x) = a^(x)g(x) = ℯ^(x)h(x) = log(a, x)Boolean b(false)k(x) = log(x)y = x
AI Drawing Prompt Reference
Draw a coordinate plane with an exponential curve and its corresponding logarithmic curve, symmetric about the line y=x. The exponential function has an adjustable base via a slider, and the logarithmic function is its inverse. Also include the natural exponential and natural logarithm curves as references. Keep the two main curves mirror-symmetric about y=x, and show the line y=x as the axis of symmetry.
The prompt above was compiled from the original drawing commands and is for reference only.