
Graphing Exponential Functions with Interactive Controls
Loading the math board and drawing, please wait…
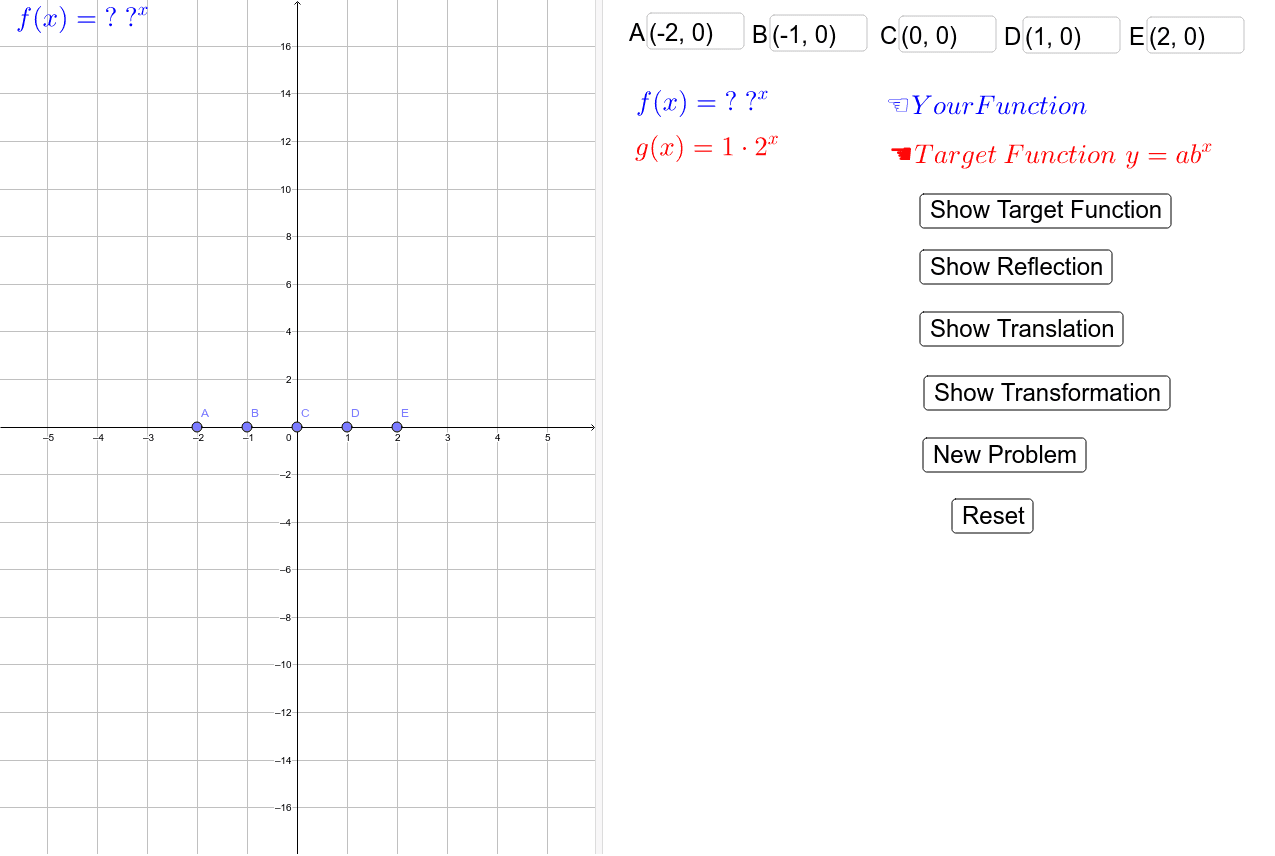
This GeoGebra example demonstrates how to dynamically graph exponential functions and explore their behavior through interactive input boxes and buttons. The core mathematical concepts include the general form of exponential functions y = a·b^x, exponential growth and decay, horizontal and vertical translations, reflections, and the use of the FitGrowth command for fitting exponential models to data. The construction uses the FitGrowth command on data lists list1 and list2, multiple input boxes (InputBox1 to InputBox5) and buttons (button1 to button5) to adjust parameters a, b, c, d, e, and to toggle display options such as ShowReflection, ShowTranslation, and ShowTargetFunction. Text objects (text1 to text9) provide dynamic numerical feedback. This resource is suitable for high school or introductory college students learning exponential functions, transformations, and data fitting, either for classroom demonstration or self-guided exploration.
GeoGebra Commands & Parameters
FitGrowth({A, B, C, D, E}) → fTextfield(A) → InputBox1Textfield(B) → InputBox2Textfield(C) → InputBox3Textfield(D) → InputBox4Textfield(E) → InputBox5