
Exploring Triangle Side Relationships
Loading the math board and drawing, please wait…
In collections
Congruence (CO) Cluster
Congruence (Vol 2)
Geometry (Congruence) Volume 2
CCSS High School: Geometry (Congruence) Volume 2
CCSS High School: Geometry (Congruence) Volume 2
CCSS High School: Geometry (Congruence) Volume 2
CCSS High School: Geometry (Congruence) Volume 2
CCSS High School: Geometry (Congruence) Volume 2
CCSS High School: Geometry (Congruence) Volume 2
CCSS High School: Geometry (Congruence) Volume 2
Gail LeBlancCCSS High School: Geometry (Congruence) Volume 2
Triangle Theorems
CBSE Class VI Maths
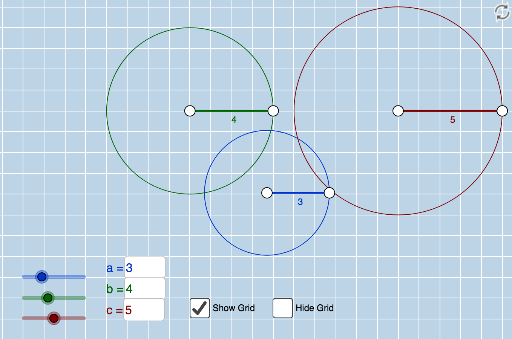
This example demonstrates the Triangle Inequality Theorem using an interactive applet. Students can intuitively and informally discover the theorem. It involves core math concepts like triangle side relationships and inequalities. Constructed with GeoGebra commands: Point, Segment, Textfield, Circle; objects: a, b, c, A, B, f, C, D, g, E, F, h, InputBox1, InputBox2, InputBox3, d, e, k, p, q. Suitable for middle school and above students to grasp the theorem visually.
GeoGebra Commands & Parameters
Point(Circle[A, a]) → BSegment(A, B) → fPoint(Circle[C, b]) → DSegment(C, D) → gPoint(Circle[E, c]) → FSegment(E, F) → hTextfield(a) → InputBox1Textfield(b) → InputBox2Textfield(c) → InputBox3Circle(A, B) → kCircle(C, D) → pCircle(E, F) → q
AI Drawing Prompt Reference
Create an interactive diagram to demonstrate the Triangle Inequality Theorem. Include three variable-length line segments representing the sides of a triangle, and draw three circles with each pair of line segments as diameters. When all three circles intersect, the line segments can form a triangle, visually illustrating the theorem. Users can adjust the lengths via input boxes to observe the intersection of circles and the existence of the triangle.
The prompt above was compiled from the original drawing commands and is for reference only.