
Exploring the Unit Circle: Dynamic Visualization of Trigonometry and Special Ang
Loading the math board and drawing, please wait…
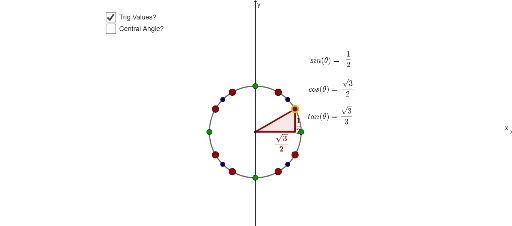
① This interactive GeoGebra example dynamically visualizes the relationship between points on the unit circle and their corresponding angles, making the geometric meaning of trigonometric functions tangible. ② Core mathematical concepts include the unit circle definition, sine/cosine/tangent functions, exact values for special angles (30°, 45°, 60°), angle-radian conversion, and visual comparison of triangle areas and sector areas. ③ Construction highlights: using GeoGebra commands such as Point, Sequence, Segment, Polygon, Angle, and Random, the applet builds the unit circle c, a movable point P1, angle sequences (Angles, Angles306090, Angles459045, AnglesVH), special-angle triangles (Triangle306090, Triangle459045, TriangleVH) with labeled side lengths, and dynamic angle labels (e.g., label1piover6V). Conditional display via If and Min commands enables interactive exploration. ④ Suitable for high school or early college mathematics, this resource serves as a teaching aid for trigonometry fundamentals, unit circle properties, and as a self-guided student exploration tool.
GeoGebra Commands & Parameters
Point(c) → ASequence(((π * k)) / 12, k, 0, 24) → AnglesSequence((cos(Element[Angles306090, k]), sin(Element[Angles306090, k])), k, 1, 9) → Pts306090Segment(O, B) → dMin(abs(Angles306090 - acosd(x(A)))) → d306090Min(abs(Angles459045 - acosd(x(A)))) → d459045Min(abs(AnglesVH - acosd(x(A)))) → dVHIf(d306090 ≤ d459045 ∧ d306090 ≤ dVH, 1, 0) → is306090If(d459045 < d306090 ∧ d459045 < dVH, 1, 0) → is459045If(dVH < d306090 ∧ dVH < d459045, 1, 0) → isVHIf(y(A) > 0, acosd(x(A)), π + acosd((-x(A)))) → thetaPolygon(O, A, B) → Triangle306090, b, o, aPolygon(O, A, B) → Triangle459045, b_1, o_1, a_1Polygon(O, A, B) → TriangleVH, b_2, o_2, a_2Sequence((cos(Element[Angles459045, k]), sin(Element[Angles459045, k])), k, 1, 4) → Pts459045Sequence((cos(Element[AnglesVH, k]), sin(Element[AnglesVH, k])), k, 1, 4) → PtsVHSequence((cos(Element[AnglesAll, k]), sin(Element[AnglesAll, k])), k, 1, Length[AnglesAll]) → PtsAllElement(AnglesAllLabels, 2) → FailRandom(1, 14) → randIntIf(π / 2 < theta ∧ theta < ((3 * π)) / 2, "-", "") → negCosIf(tan(theta) < 0, "-", "") → negTanAngle(O2, O, A) → alphaGreenIf(theta ≟ π / 3 ∨ theta ≟ (2 * π / 3) ∨ theta ≟ (4 * π / 3) ∨ theta ≟ (5 * π / 3), 1) → isTall306090If(theta ≟ π / 6 ∨ theta ≟ (5 * π / 6) ∨ theta ≟ (7 * π / 6) ∨ theta ≟ (11 * π / 6), 1) → isSkinny306090If(theta ≟ π / 4 ∨ theta ≟ (3 * π / 4) ∨ theta ≟ (5 * π / 4) ∨ theta ≟ (7 * π / 4), 1) → isReal459045If(theta ≟ 0 ∨ theta ≟ π ∨ theta ≟ (2 * π), 1) → isHPoint(xAxis) → CPoint(xAxis) → DPoint(xAxis) → EPoint(xAxis) → FPoint(yAxis) → GPoint(yAxis) → HPoint(yAxis) → IPoint(yAxis) → JPoint(c_1) → A_1Point(c_2) → A_2Angle(O2, O, A) → alphaRedAngle(O2, O, A) → alphaBluePoint(c_3) → A_3If(y(A_3) > 0, acosd(x(A_3)), π + acosd((-x(A_3)))) → theta_1If(π < theta ∧ theta < (2 * π), "-", "") → negSin
AI Drawing Prompt Reference
Draw a unit circle centered at the origin with radius 1. Place a movable point on the circle and display its corresponding angle in both radians and degrees. Draw a radius from the center to this point, and construct a right triangle using the center, the point, and the foot of the perpendicular on the x-axis, labeling its side lengths. Mark special points on the circle for 30°, 45°, 60° and their symmetric angles, and connect these points to form special triangles (e.g., 30-60-90 and 45-45-90) with distinct colors. Also show the sign changes of sine, cosine, and tangent values, and dynamically compare the triangle area with the sector area. Add an angle slider to interactively change the point's position and observe the changes in trigonometric values.
The prompt above was compiled from the original drawing commands and is for reference only.