
Exploring the Slope-Intercept Form of a Linear Equation
Loading the math board and drawing, please wait…
In collections
Slope
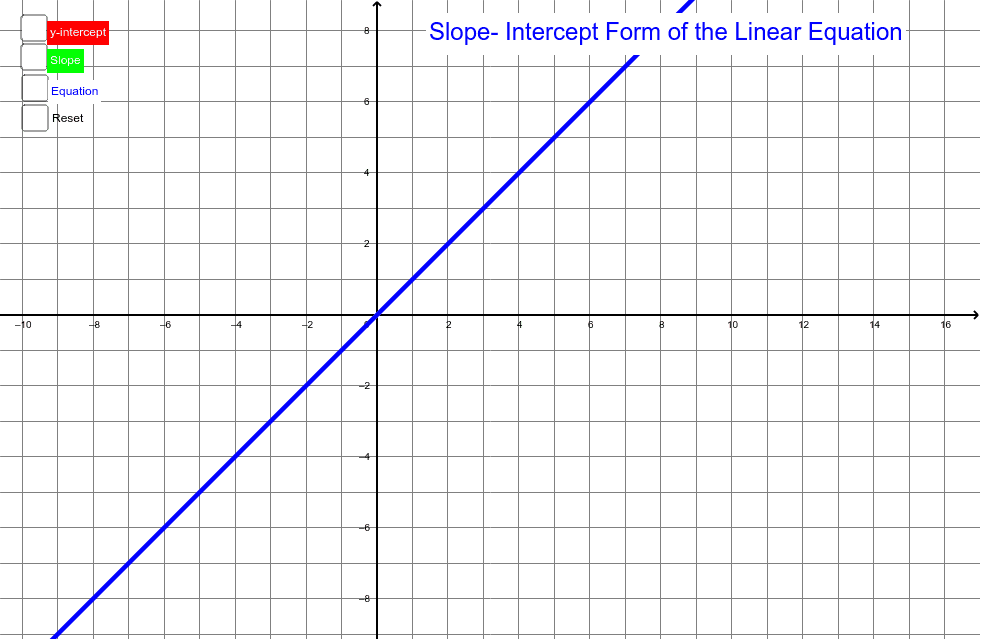
This example uses GeoGebra to explore the graph of a linear equation in the form y=mx+b. It covers core math concepts like slope, y-intercept, and linear function graphs. The construction involves commands and objects such as Intersect, Slope, OrthogonalLine, Segment, Vector, and Midpoint. Ideal for high school mathematics education to understand the geometric meaning and effects of parameter changes on linear equations.
GeoGebra Commands & Parameters
Intersect(c, yAxis) → BSlope(c) → dOrthogonalLine(P, xAxis) → eIntersect(c, e) → ASegment(B, P) → fVector(P, A) → uVector(B, P) → vMidpoint(P, A) → C
AI Drawing Prompt Reference
Draw a line showing its slope and y-intercept, represent the slope and direction with vectors, find the midpoint of the line segment and the intersection with the x-axis, construct the graph using these points to explore the geometric meaning of the linear equation y=mx+b and observe the effects of parameter changes.
The prompt above was compiled from the original drawing commands and is for reference only.