
Exploring the Form of Quadratic Functions
Loading the math board and drawing, please wait…
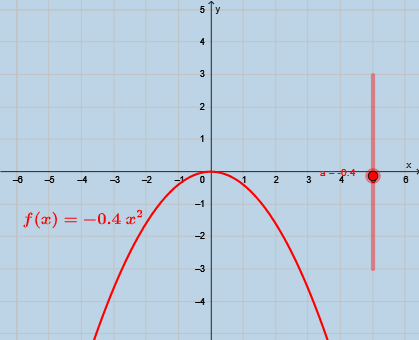
① This interactive GeoGebra example dynamically demonstrates how the graph of a quadratic function y = ax² + bx + c changes its shape and position as parameters vary, allowing learners to explore the relationship between the general form and the vertex form. ② Core mathematical concepts include quadratic functions, parabolas, vertex, axis of symmetry, the effects of coefficients a, b, c on the graph, and transformations such as translation, scaling, and rotation. ③ Construction details: based on the summary, the example uses objects such as a (likely a slider parameter), f (the quadratic function graph), text2 and text3 (to display the function expression or parameter values), and button1 (for resetting or toggling display modes), all built with GeoGebra commands to create an interactive parameter-adjustment and visual-feedback environment. ④ Suitable for middle school to high school students learning quadratic functions, as well as for teacher-led demonstrations or student self-exploration, bridging algebraic forms with geometric intuition and deepening understanding of function graph properties.
GeoGebra Commands & Parameters
Numeric a(-0.4)f(x) = (a * x^(2))