
Exploring Same Standard Deviation
Loading the math board and drawing, please wait…
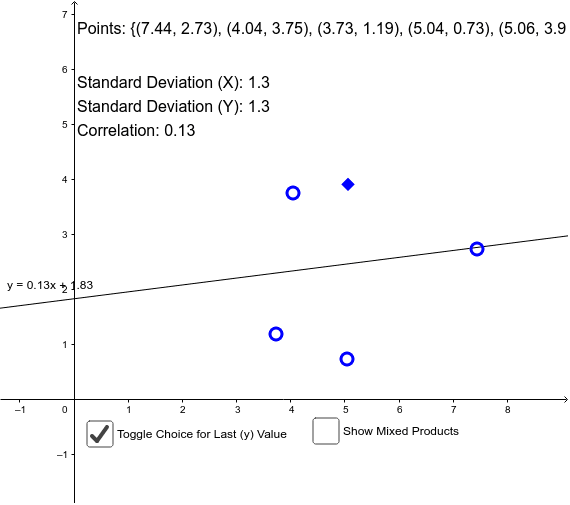
This example demonstrates how to dynamically adjust the y-values using GeoGebra to ensure the standard deviation of y-coordinates matches that of x-coordinates. Core math concepts include standard deviation, mean, linear regression, and correlation coefficient. Key GeoGebra commands and objects used are Point, MeanX, DynamicCoordinates, MeanY, RectanglefromDiagonal, SDY, FitLineY, PMCC, SDX. Suitable for high school mathematics teaching to understand the relationship between data distribution and statistical measures.
GeoGebra Commands & Parameters
Point(xAxis) → E_1MeanX({A, B, C, D, E_1}) → mean_XDynamicCoordinates(E_1, x(E_1), If[useFirstChoice, firstChoice, secondChoice]) → EMeanY({A, B, C, D, E}) → mean_YRectanglefromDiagonal((MeanX[{A, B, C, D, E}], mean_Y), A) → poly1RectanglefromDiagonal((MeanX[{A, B, C, D, E}], mean_Y), B) → poly2RectanglefromDiagonal((MeanX[{A, B, C, D, E}], mean_Y), E) → poly5RectanglefromDiagonal((MeanX[{A, B, C, D, E}], mean_Y), C) → poly3RectanglefromDiagonal((MeanX[{A, B, C, D, E}], mean_Y), D) → poly4SDY({A, B, C, D, E}) → stdev_YFitLineY({A, B, C, D, E}) → bestFitLinePMCC({A, B, C, D, E}) → CorrelationSDX({A, B, C, D, E}) → stdev_X
AI Drawing Prompt Reference
Plot five data points on a coordinate plane, with four fixed and one movable along the x-axis. For each point, draw a rectangle whose diagonal connects the point to the mean point, illustrating deviations from the mean. Dynamically adjust the y-coordinate of the movable point so that the standard deviation of y-values equals that of x-values. Add a best-fit line and display the correlation coefficient. The figure should clearly show the relationship between data spread, mean, standard deviation, and regression.
The prompt above was compiled from the original drawing commands and is for reference only.