
Exploring Quadratic Functions: Dynamic Geometry of Graphs and Properties
Loading the math board and drawing, please wait…
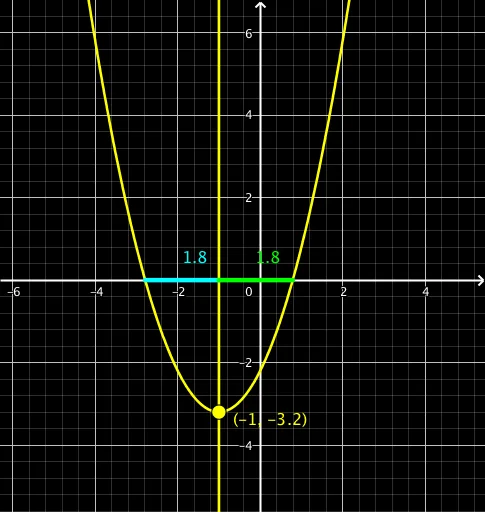
① This GeoGebra example dynamically demonstrates how the graph of a quadratic function changes under translations and scaling, using auxiliary elements like secant lines and similarity transformations to reveal geometric features of the parabola. ② Core mathematical concepts include the standard form of quadratic functions, axis of symmetry, vertex coordinates, the relationship between secant slope and average rate of change, and similarity transformations (translation, scaling) affecting the graph, with additional contexts involving rational numbers, pyramids (possibly geometric projections), and geometric distributions. ③ Construction highlights: The construction uses the Segment command to create line segments, defines multiple points (A, P, Q, B, D, C, E, F) and function objects (f, g, h), along with auxiliary objects R1, R2 and text labels text1, text2. By dragging dynamic points or sliders, users can observe how the graph changes, and the secant line helps study the average rate of change between two points on the curve. ④ Suitable for upper secondary students (grades 9–12) learning quadratic functions, and useful for classroom demonstrations or self-exploration to build an intuitive link between algebraic expressions and their graphical representations.
GeoGebra Commands & Parameters
Segment(F, E) → hSegment(C, F) → i