
Exploring Probability Test
Loading the math board and drawing, please wait…
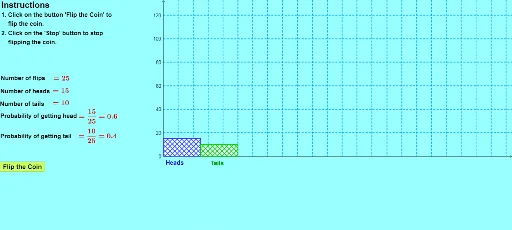
This example demonstrates the process of a probability test, involving core concepts of probability and statistics. Using GeoGebra commands such as Random and BarChart, users can observe the distribution of random experiment results visually. Suitable for high school math education, this tool helps students understand probability distributions and statistical characteristics.
GeoGebra Commands & Parameters
Random(0, 1) → ddBarChart(0, 1, freq) → aBarChart(0, 1, relfreq) → bRay((0, 0.5), (5, 0.5)) → cCorner(1) → cr1Corner(2) → cr2Corner(3) → cr3Corner(4) → cr4Polygon(cr1, ((2 * cr1) + cr2) / 3, (cr3 + (2 * cr4)) / 3, cr4) → q1, cr1_1, g, h, cr4_1Polygon(((2 * cr1) + cr2) / 3, cr2, cr3, (cr3 + (2 * cr4)) / 3) → q2, j, cr2_1, cr3_1, k