
Exploring Polynomial Parameters: Interactive Sliders for Coefficients
Loading the math board and drawing, please wait…
In collections
Learn GeoGebra Classic
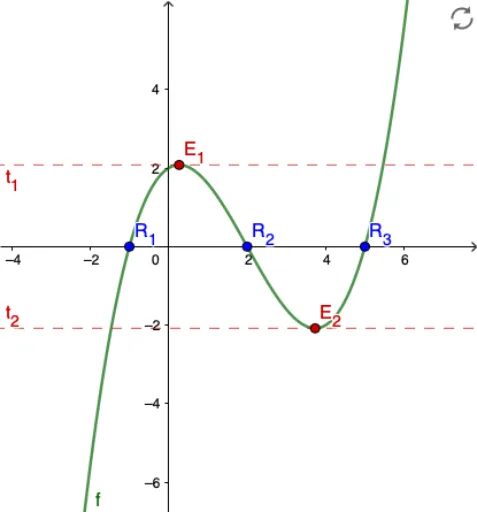
This GeoGebra example demonstrates how the graph of a polynomial function changes as its parameters are varied. By using sliders to adjust the coefficients a, b, c, and d, users can observe in real time how the curve bends, shifts, and stretches, while key features such as extrema, roots, and tangent lines are automatically highlighted. The core mathematical concepts include polynomial functions, transformations of graphs, extrema (maxima and minima), zeros (roots), and the slope of tangent lines. The construction utilizes GeoGebra commands such as Extremum to mark local extrema, Root to find x-intercepts, and Tangent to draw tangent lines at specified points, all controlled by interactive sliders. This resource is ideal for high school or early college students learning about the relationship between polynomial coefficients and their graphs, and serves as an intuitive introduction to derivatives and critical points in calculus.
GeoGebra Commands & Parameters
Extremum(f) → E_1, E_2Root(f) → R_1, R_2, R_3Tangent(E_1, f) → t_1Tangent(E_2, f) → t_2
AI Drawing Prompt Reference
Draw the graph of a cubic polynomial function whose coefficients are controlled by four interactive sliders, adjusting the constant, linear, quadratic, and cubic terms. The curve should be smooth, with all local maxima and minima automatically marked as points, and all x-intercepts (roots) indicated. At each extremum, draw a horizontal tangent line to show where the slope is zero. The overall scene should clearly illustrate how the curve bends, shifts, and stretches as the coefficients change, suitable for educational demonstration.
The prompt above was compiled from the original drawing commands and is for reference only.