
Exploring Negative Numbers with Thermometer Model
Loading the math board and drawing, please wait…
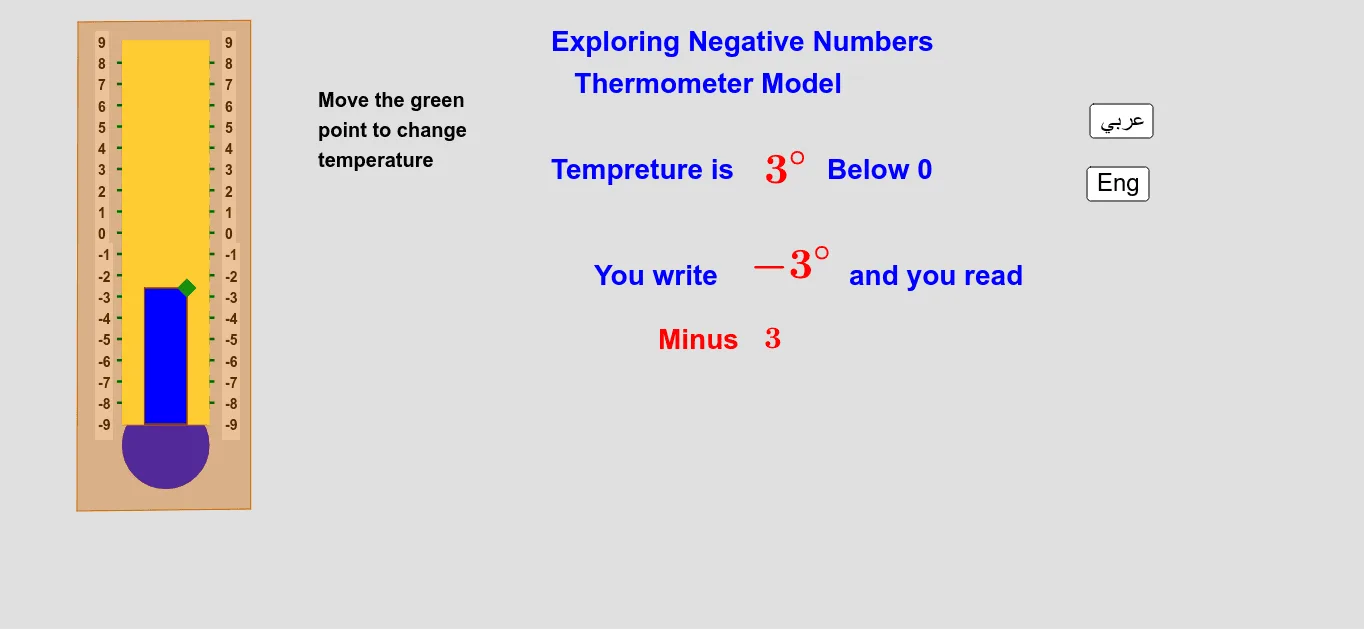
This example uses a thermometer model to explore negative numbers, demonstrating how negative numbers are represented on a thermometer. Key mathematical concepts include negative numbers and their representation. Using GeoGebra commands such as Point, Segment, and Polygon, the example dynamically shows temperature changes. Suitable for middle school and above students to learn about negative numbers and their applications.
GeoGebra Commands & Parameters
Point(q) → TSegment(A, C) → aSegment(B, D) → bSegment(B, A) → cSegment(D, C) → dPolygon(A, B, D, C) → poly1, a_1, b_1, d_1, c_1Circle(F, 1) → fPolygon(A, C, D, B) → poly2, a_2, c_2, d_2, b_2Sequence((x(A), y(A) + (k * e)), k, 1, 17) → list1Sequence((x(B), y(B) + (k * e)), k, 1, 17) → list3Polygon((-1.5, -4.5), (-1.5, y(T)), (-2.5, y(T)), (-2.5, -4.5)) → poly3, g, i, j, kSequence(Text[k, (x(A) + 0.4, y(A) - 0.15 + ((k + 9) * e))], k, -9, 9) → list2Sequence(Text[k, (x(B) - 0.6, y(B) - 0.15 + ((k + 9) * e))], k, -9, 9) → list4Polygon((-1.5, -4.5), (-1.5, y(T)), (-2.5, y(T)), (-2.5, -4.5)) → poly4, h, l, m, nCircle(F, 1) → pPolygon(E, G, H, I) → poly5, e_1, g_1, h_1, i_1
AI Drawing Prompt Reference
Draw a thermometer model to explore negative numbers, showing how negative numbers are represented on a thermometer. Create a horizontal segment as the base of the thermometer and two vertical segments on either side. Plot a series of points above the base to form the temperature markings, and add number labels below each marking. Fill the left and right sides of the thermometer with polygons to complete the model, visually demonstrating the concept and representation of negative numbers.
The prompt above was compiled from the original drawing commands and is for reference only.