
Exploring Monotonicity Intervals of a Function
Loading the math board and drawing, please wait…
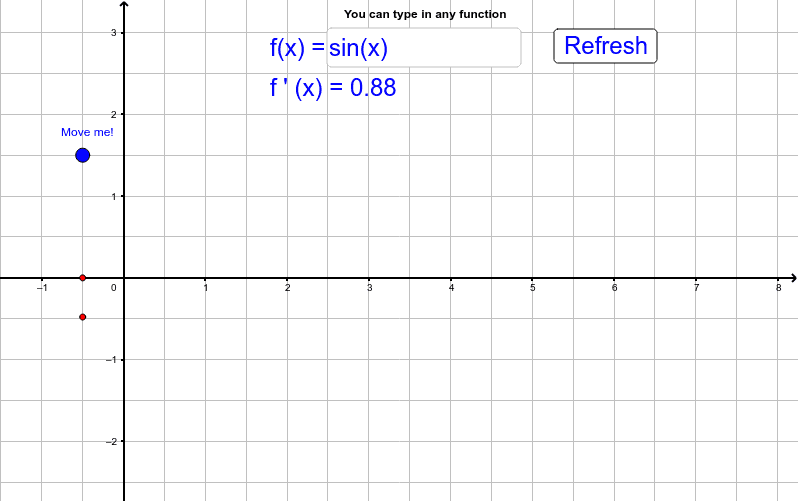
① This interactive GeoGebra example demonstrates how to determine the monotonicity (increasing or decreasing) intervals of a function on a given domain, visually highlighting where the function rises or falls. ② The core mathematical concept is the relationship between the derivative and monotonicity: the function is increasing where its derivative is positive and decreasing where the derivative is negative, with sign changes marking interval boundaries. ③ Construction details: The example uses a Textfield and InputBox1 for entering the function expression, defines the function f and its derivative g, employs a button (button1) to trigger calculations, a slider m to adjust the interval, and text objects text1 and text2 to display results. Points A and B are used to mark key locations on the graph. ④ This resource is suitable for high school or early college calculus students, serving as a visual aid for classroom instruction or self-study, and can be adapted by teachers to create interactive exercises on derivative-based monotonicity analysis.
GeoGebra Commands & Parameters
Textfield(f) → InputBox1
AI Drawing Prompt Reference
Draw a function and its derivative, highlighting the intervals where the function is increasing or decreasing. An input box allows entering the function expression, which then plots the function and its derivative. Use a slider to adjust the displayed interval, with text annotations indicating where the function is rising or falling. Key points mark the function graph, showing the function rises where the derivative is positive and falls where negative, with sign changes marking interval boundaries.
The prompt above was compiled from the original drawing commands and is for reference only.