
Exploring How Quadratic Coefficients Change Parabola Shapes
Loading the math board and drawing, please wait…
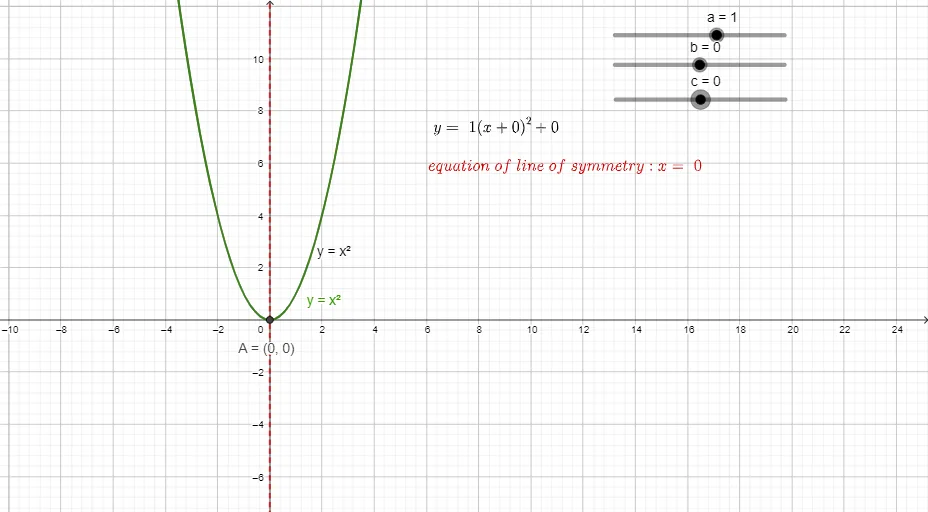
① This activity dynamically demonstrates how changing the coefficients a, b, and c in the quadratic function y=ax²+bx+c alters the parabola's opening direction, width, axis of symmetry, and vertex position. ② Core mathematical concepts include quadratic functions, parabolas, vertex coordinates, axis of symmetry, and the relationship between coefficients and graph transformations. ③ Construction highlights: using GeoGebra commands Vertex to locate the parabola's vertex and Line to draw the axis of symmetry, with sliders for a, b, c to control coefficients, plus text objects text1 and text2 to display the live function expression and vertex coordinates; auxiliary objects g and h likely serve as guides or reference lines. ④ Suitable for middle and high school students learning quadratic function properties, and useful for classroom demonstrations or self-directed exploration to build an intuitive understanding of how coefficients affect the graph.
GeoGebra Commands & Parameters
Vertex(f) → A, , ,Line(A, yAxis) → g
AI Drawing Prompt Reference
Create a dynamic graph of a quadratic parabola with three sliders controlling the coefficients of the quadratic, linear, and constant terms. The parabola changes its opening direction, width, axis of symmetry, and vertex position as the coefficients vary. Mark the vertex of the parabola and draw a dashed vertical line through the vertex as the axis of symmetry. Display the current function expression and vertex coordinates as text near the graph. The layout should be clear for educational demonstration, showing how coefficient changes affect the parabola's shape.
The prompt above was compiled from the original drawing commands and is for reference only.