
Exploring Histograms
Loading the math board and drawing, please wait…
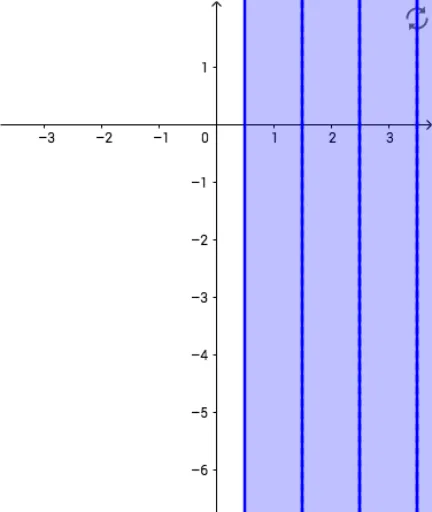
This example demonstrates how to create and explore histograms using GeoGebra, showcasing data distribution features. Core math concepts include Probability & Statistics, Set Theory, Fractions, Continuity, and Linear Functions. Construction highlights involve GeoGebra objects A1-A7 and B1-B7 for plotting data points and histogram structures. Suitable for high school mathematics education to understand data visualization and statistical distributions.
GeoGebra Commands & Parameters
A2: 0.5 ≤ x < 1.5A3: 1.5 ≤ x < 2.5A4: 2.5 ≤ x < 3.5A5: 3.5 ≤ x < 4.5A6: 4.5 ≤ x < 5.5A7: 5.5 ≤ x < 6.53571053