
Exploring Graphs of Various Sine Functions
Loading the math board and drawing, please wait…
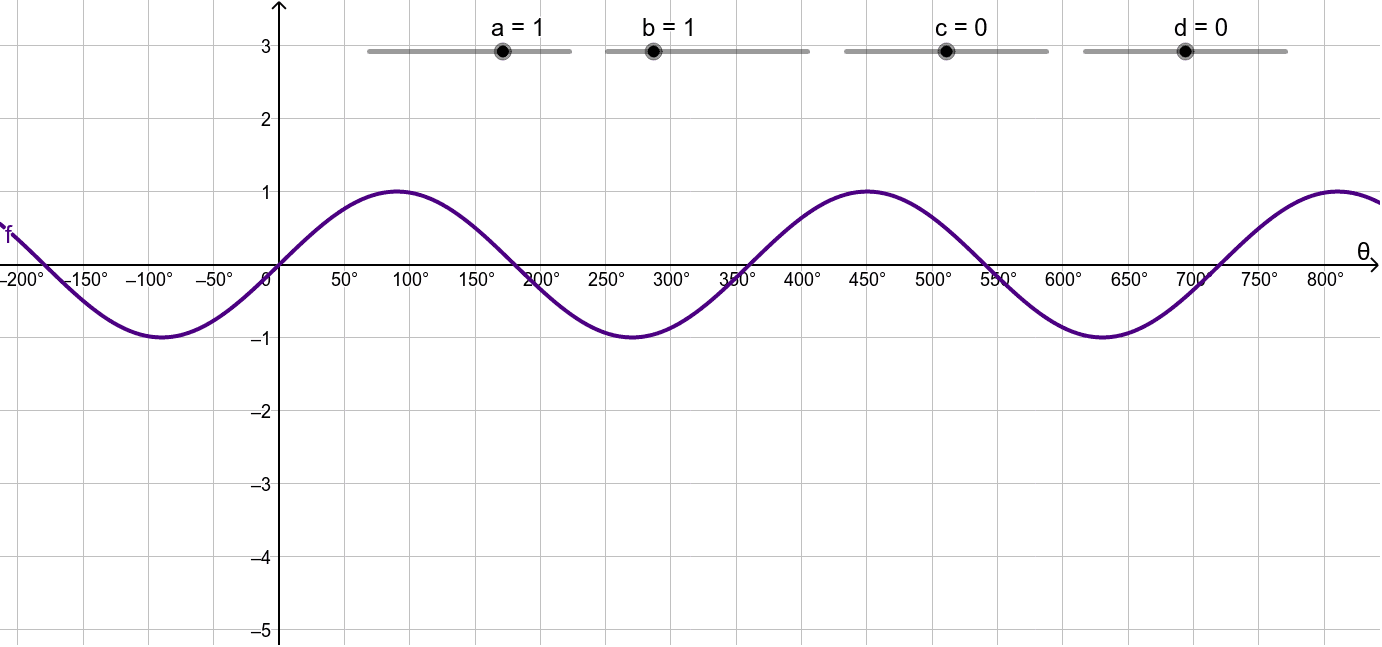
This example demonstrates how to draw and adjust a range of sine functions, illustrating how constants can shift and scale the function. By adjusting parameters a, c, d, b, and f, you can observe changes in the sine function's graph. Suitable for high school math education, aiding students in understanding the properties of sine functions.
GeoGebra Commands & Parameters
Numeric a(1.0)Numeric c(-0.0041942418247764915)Numeric d(0.0)Numeric b(1.0)f(x) = (a * sin(((b * x) * π / 180) + c)) + d