
Graphing a Linear Function Using a Table
Loading the math board and drawing, please wait…
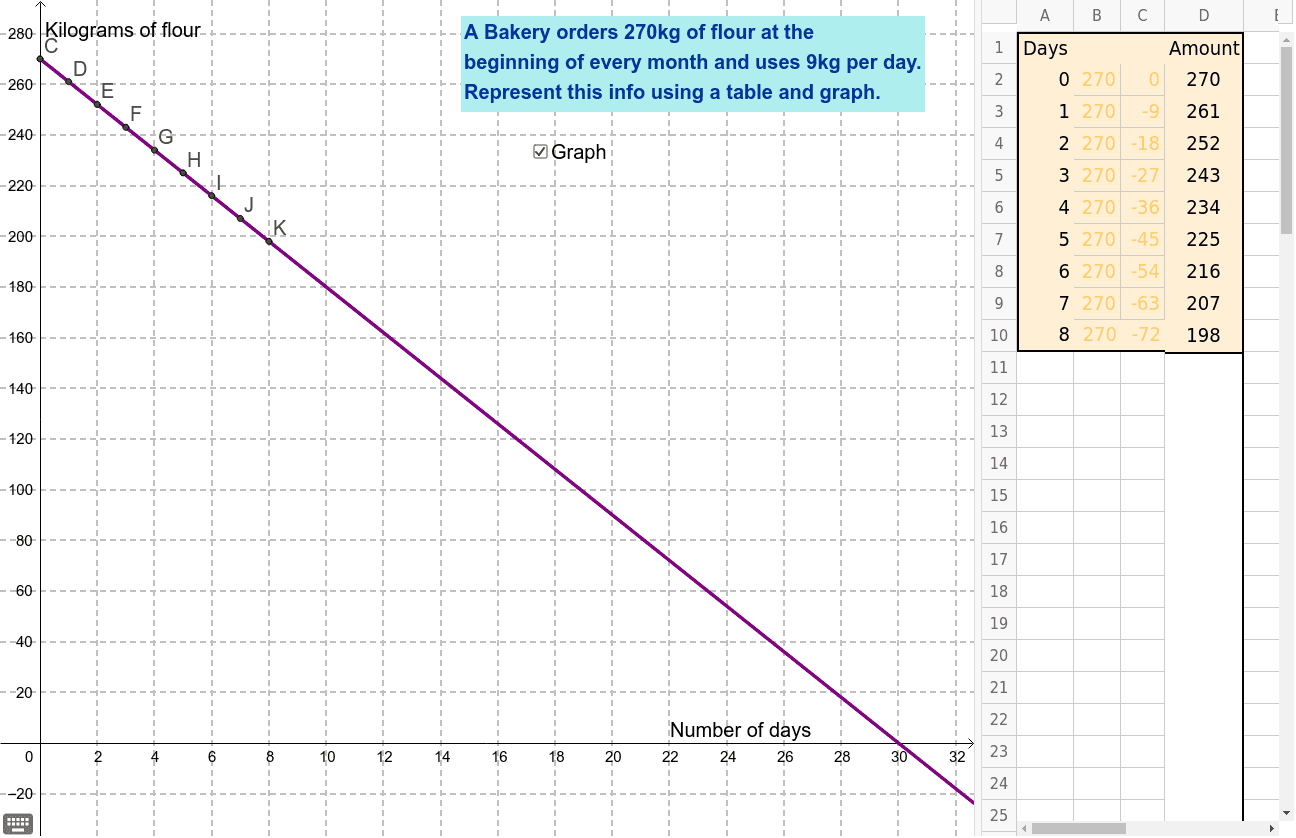
This example converts a word problem into a table and then uses GeoGebra to create a straight line graph. It demonstrates the concept of linear functions, involving subtraction and terms. Commands such as Ray are used for geometric construction. Suitable for middle school and above students to learn graphing linear functions.
GeoGebra Commands & Parameters
Ray(C, E) → a
AI Drawing Prompt Reference
Draw a straight line graph using the given table data points (2, 3) and (4, 7). First, create point A at (2, 3) and point B at (4, 7), then draw a line through these two points.
The prompt above was compiled from the original drawing commands and is for reference only.