
Exploring Graphs of Quadratic Functions 2
Loading the math board and drawing, please wait…
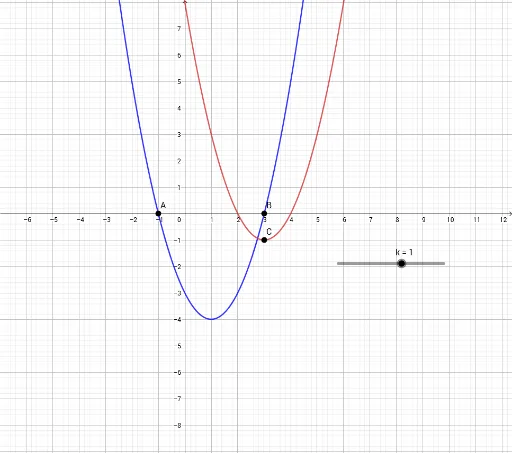
This GeoGebra example dynamically illustrates how changing the coefficients a, b, and c in the quadratic function y = ax² + bx + c affects the parabola's opening direction, axis of symmetry, and vertex position. Core mathematical concepts include the standard form of quadratic functions, completing the square, the discriminant, and transformations such as shifting and scaling. The construction uses the Point command to create key points A, B, and C, along with parameters a, b, c, p, q, k, and d (likely as sliders or numeric values) to update the graph in real time. It also highlights intersections with axes and the vertex locus. Suitable for middle-to-high school students learning quadratic function properties, as well as for classroom demonstrations or self-guided exploration of parameter effects.
GeoGebra Commands & Parameters
Point(xAxis) → APoint(xAxis) → B
AI Drawing Prompt Reference
Create a dynamic illustration of a quadratic function graph in the form y = ax² + bx + c. The parabola's opening direction, axis of symmetry, and vertex position should change as coefficients a, b, and c are adjusted. Mark two points on the x-axis representing the intersections with the x-axis. Also show the vertex locus and highlight intersections with the coordinate axes. The graph should allow real-time updates via sliders or numeric inputs, demonstrating transformations like shifting and scaling. Suitable for classroom demonstration of how coefficients affect the graph.
The prompt above was compiled from the original drawing commands and is for reference only.