
Exploring Graphs of Derivatives by Steve Hernandez
Loading the math board and drawing, please wait…
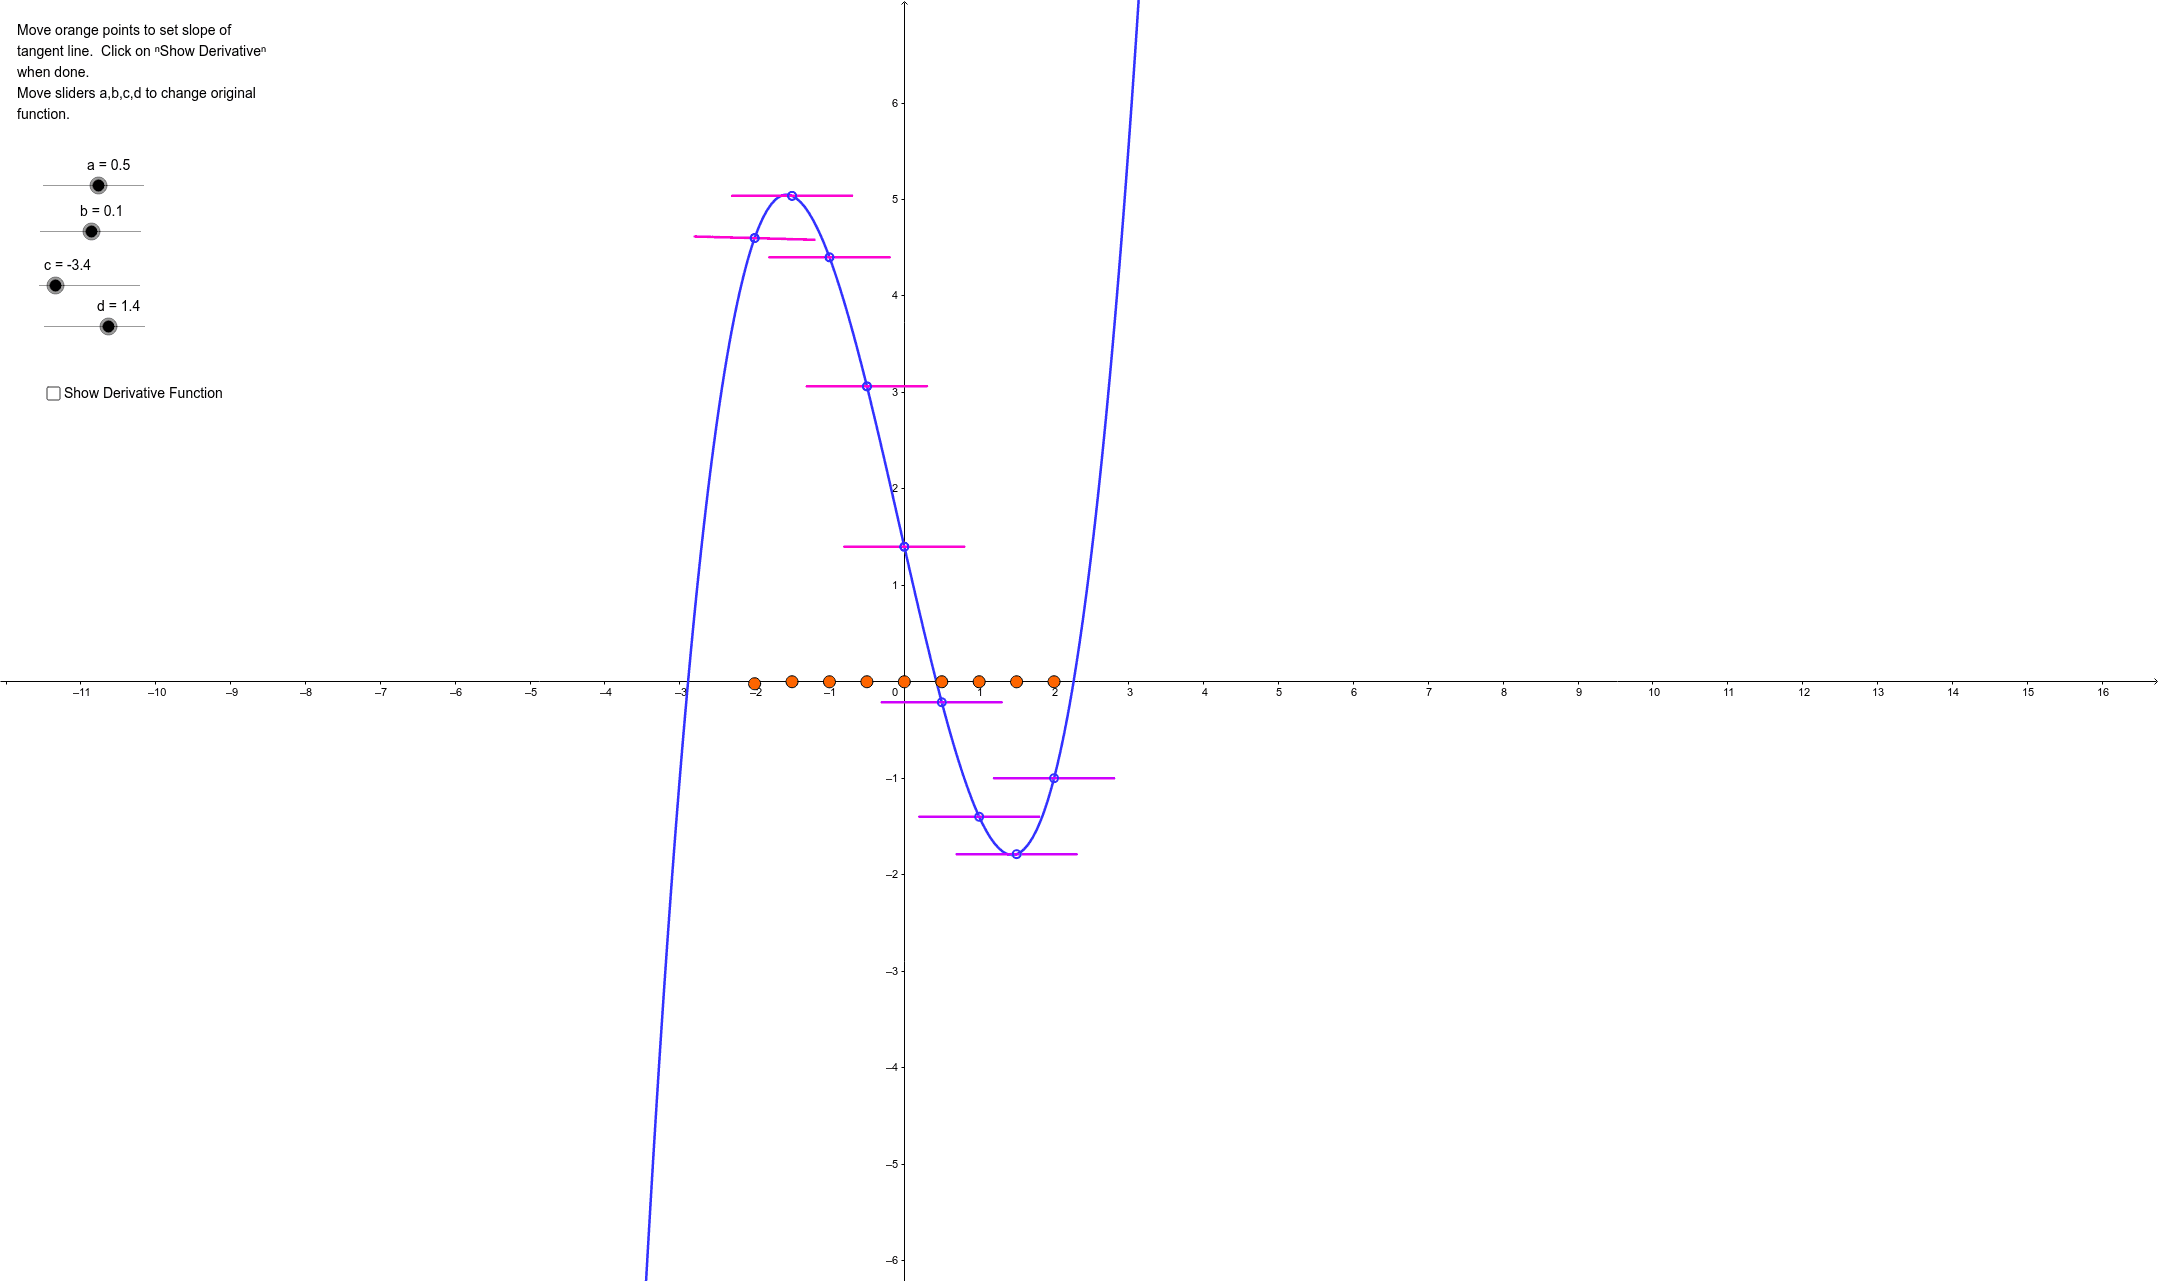
This example demonstrates the relationship between a function and its derivative graph, visually showing how the derivative represents the rate of change of the function. Key math concepts include derivatives, function graphs, rate of change, and geometric meaning. GeoGebra commands and objects used in construction are Point, Circle, Intersect, Segment, Derivative. Suitable for high school students and beginners in calculus learning the geometric meaning of derivatives and function analysis.
GeoGebra Commands & Parameters
Point(e) → ACircle(B, 0.8) → kIntersect(j, k, 1) → CIntersect(j, k, 2) → DSegment(C, D) → lDerivative(f) → f'Point(h) → ECircle(F, 0.8) → qIntersect(p, q, 1) → GIntersect(p, q, 2) → HSegment(G, H) → nPoint(g) → ICircle(J, 0.8) → sIntersect(r, s, 1) → MIntersect(r, s, 2) → NSegment(M, N) → tPoint(i) → KCircle(L, 0.8) → c_1Intersect(f_1, c_1, 1) → OIntersect(f_1, c_1, 2) → PSegment(O, P) → a_1Point(b_1) → QCircle(R, 0.8) → k_1Intersect(p_1, k_1, 1) → SIntersect(p_1, k_1, 2) → TSegment(S, T) → i_1Point(d_1) → UCircle(V, 0.8) → r_1Intersect(q_1, r_1, 2) → WIntersect(q_1, r_1, 1) → ZSegment(Z, W) → j_1Point(e_1) → A_1Circle(B_1, 0.8) → t_1Intersect(s_1, t_1, 2) → C_1Intersect(s_1, t_1, 1) → D_1Segment(D_1, C_1) → l_1Point(g_1) → E_1Circle(F_1, 0.8) → c_2Intersect(f_2, c_2, 1) → G_1Intersect(f_2, c_2, 2) → H_1Segment(G_1, H_1) → m_1Point(h_1) → I_1Circle(J_1, 0.8) → d_2Intersect(g_2, d_2, 1) → K_1Intersect(g_2, d_2, 2) → L_1Segment(K_1, L_1) → n_1