
Derivative Graphs by Steve Hernandez
Loading the math board and drawing, please wait…
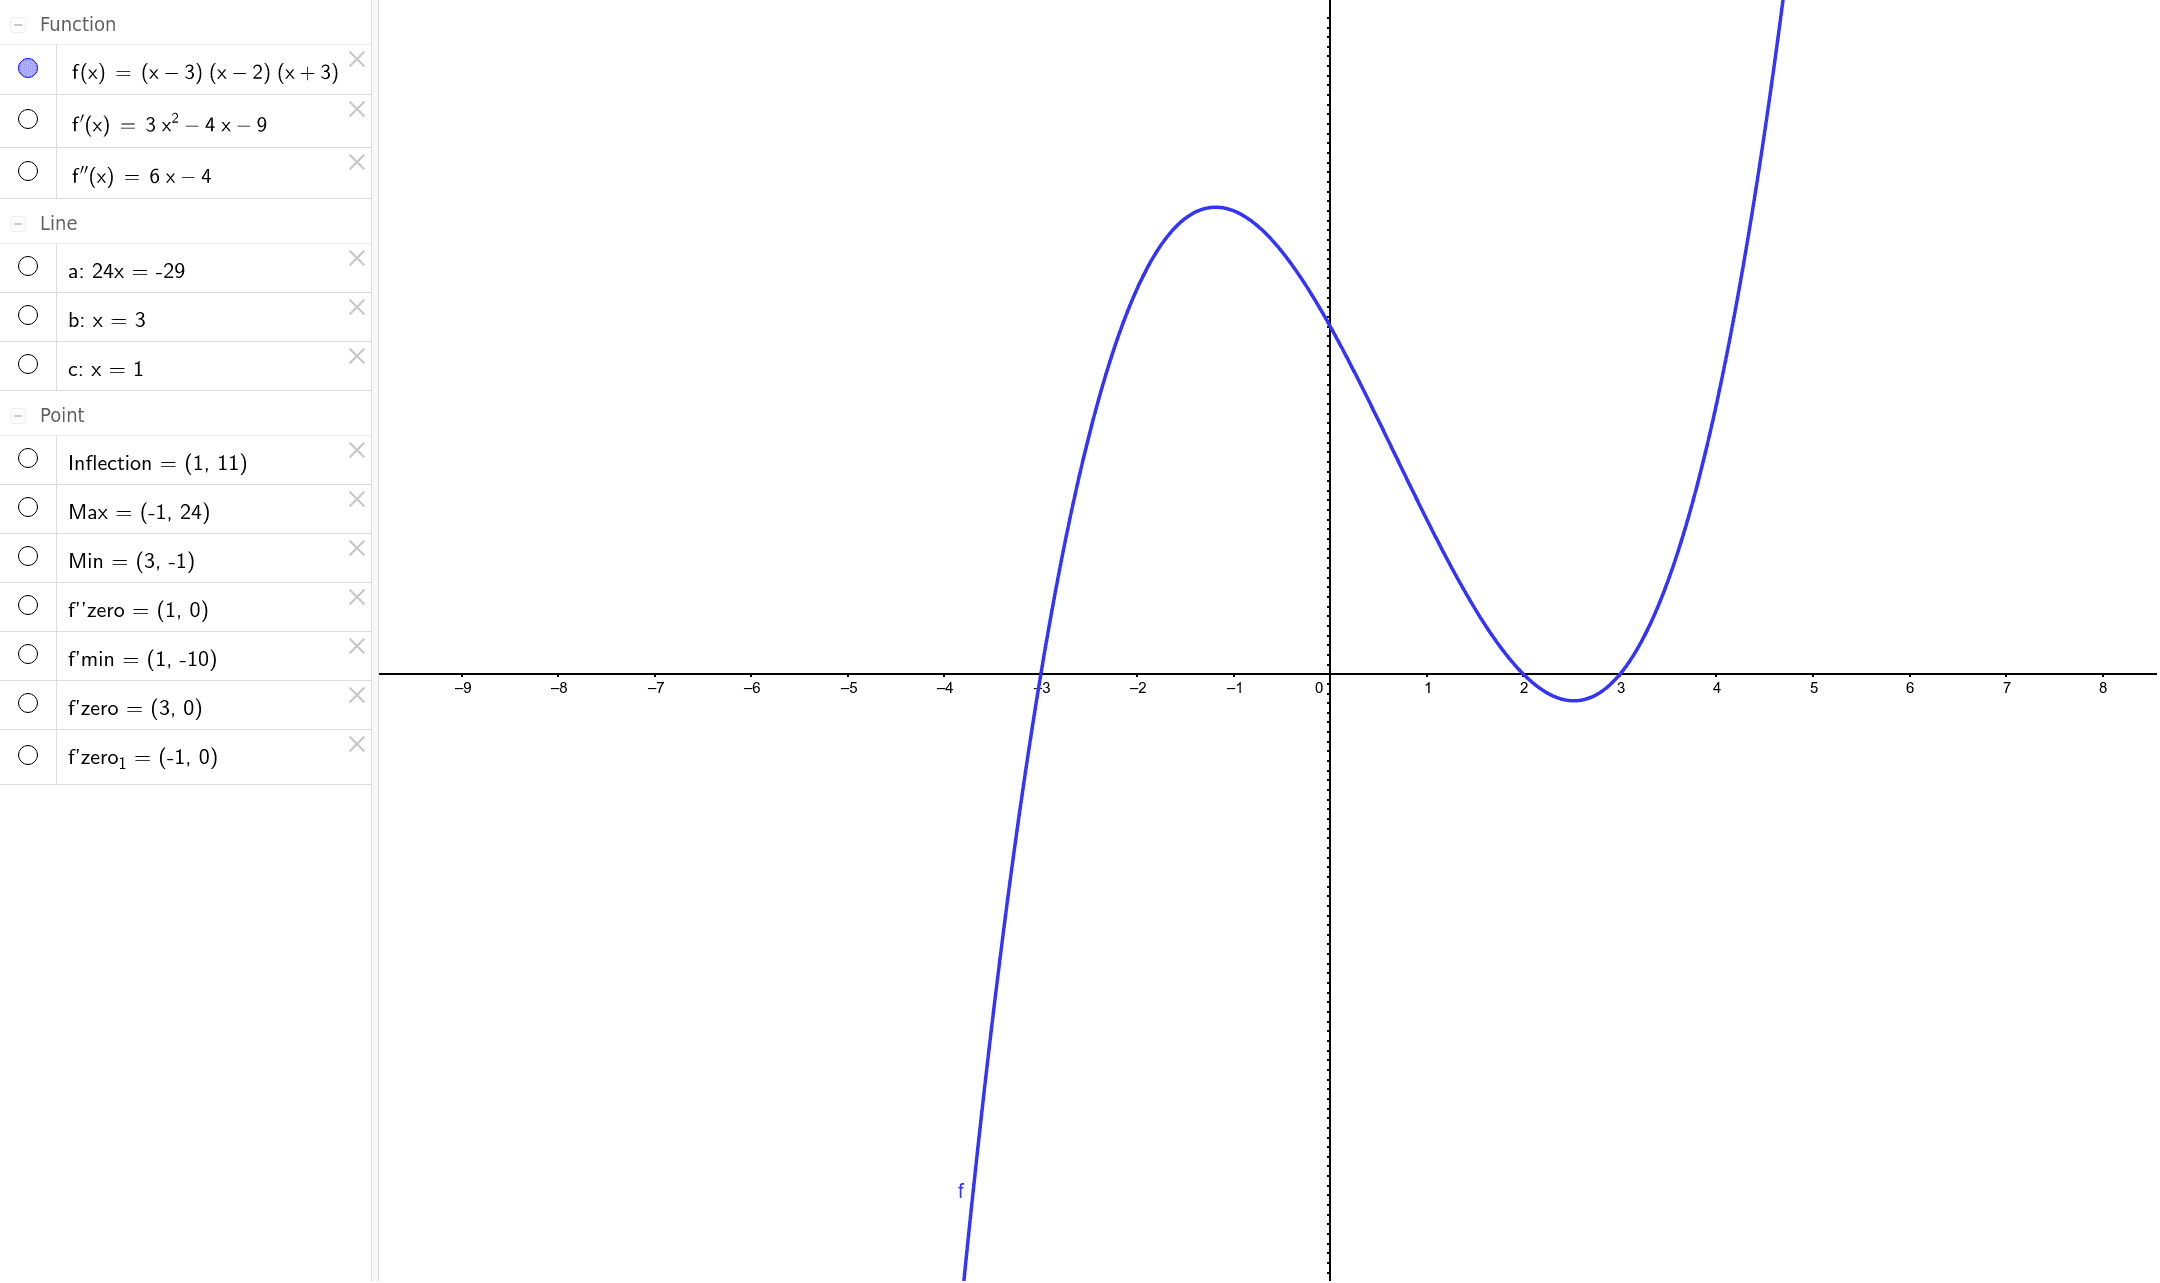
This example demonstrates how to plot the graphs of a function and its derivative, visually illustrating the function's extrema and inflection points. The core mathematical concepts involved include derivatives, extrema, and inflection points. The construction highlights the use of GeoGebra commands and objects such as Max, Root, Min, TurningPoint, and Line to accurately plot the function's maxima, minima, inflection points, and the zeros of their derivatives. Suitable for high school and above students studying calculus, helping them understand the relationship between derivatives and function graphs.
GeoGebra Commands & Parameters
Max(f, -2, 0) → MaxRoot(f') → f'zero_1, f'zeroMin(f, 1, 6) → MinTurningPoint(f) → InflectionRoot(f'') → f''zeroLine(Max, f'zero_1) → aLine(f'zero, Min) → bMin(f', -1, 2) → f'minLine(Inflection, f'min) → c