
Exploring Graphs of Derivatives by [email protected]
Loading the math board and drawing, please wait…
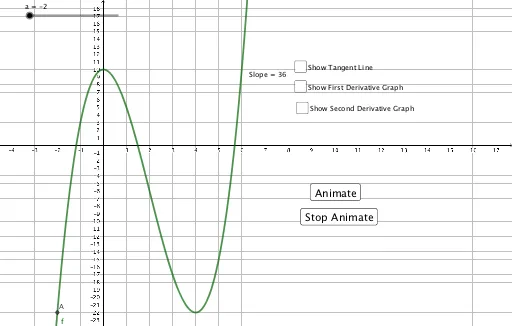
This example demonstrates how to dynamically adjust the slope of the tangent line at point a on function f to visually show the relationship between the graph of the derivative function g and the original function f. Core mathematical concepts include the geometric meaning of derivatives (slope of tangent), function graphs, and the concept of limits. Key GeoGebra commands used in construction are Tangent for drawing tangents and Slope for calculating slopes, involving objects like f, a, A, g, B, C, b, c, d, button1, button2, m, text1. It is suitable for high school and above students studying calculus, helping them understand the correspondence between derivative graphs and original function images, enhancing visual comprehension.
GeoGebra Commands & Parameters
Tangent(A, f) → gSlope(g) → m
AI Drawing Prompt Reference
Draw the graph of function f, then draw the tangent line g at point A, and observe how the slope m of the tangent line changes as you move point A. This will help you understand the relationship between the derivative function g and the original function f. First, plot function f, then draw the tangent line g at point A, and finally calculate the slope m of the tangent line to see how it changes as you move point A.
The prompt above was compiled from the original drawing commands and is for reference only.