
Derivative of e(x): Tangent Line Visualization
Loading the math board and drawing, please wait…
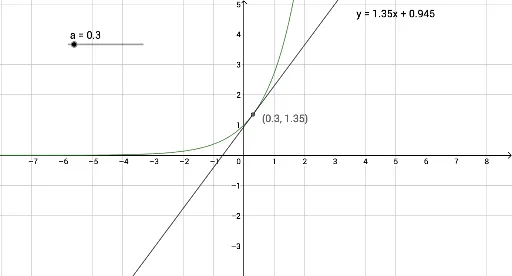
This GeoGebra example dynamically illustrates the derivative of the exponential function e(x) by constructing the tangent line at a movable point A on the curve. It demonstrates the geometric meaning of the derivative as the slope of the tangent, and highlights the unique property that the derivative of e^x is itself. The construction uses the Tangent command with objects f (the function), a (a parameter or x-coordinate), A (the point), and g (the resulting tangent line). Vectors and coordinates are likely used to display the slope vector and point coordinates, making the relationship between the function and its derivative visually explicit. This resource is suitable for high school or introductory college calculus students, serving as an interactive tool for exploring the derivative concept, the exponential function's self-derivative property, and the connection between algebraic derivatives and graphical tangents. It can be used for self-study, classroom demonstrations, or as a basis for further exploration of derivative rules.
GeoGebra Commands & Parameters
Tangent(A, f) → g
AI Drawing Prompt Reference
Draw the graph of the exponential function e^x. Place a movable point on the curve. At this point, construct a tangent line that touches the curve, clearly showing the slope. Use an arrow or segment to represent the slope vector at that point, and label the coordinates of the point. The figure should emphasize the relationship between the tangent line and the curve at the point of tangency, illustrating that the derivative of e^x equals the function itself. Keep the visualization clean and suitable for explaining the geometric meaning of derivatives.
The prompt above was compiled from the original drawing commands and is for reference only.