
Basic Kinematics Vectors
Loading the math board and drawing, please wait…
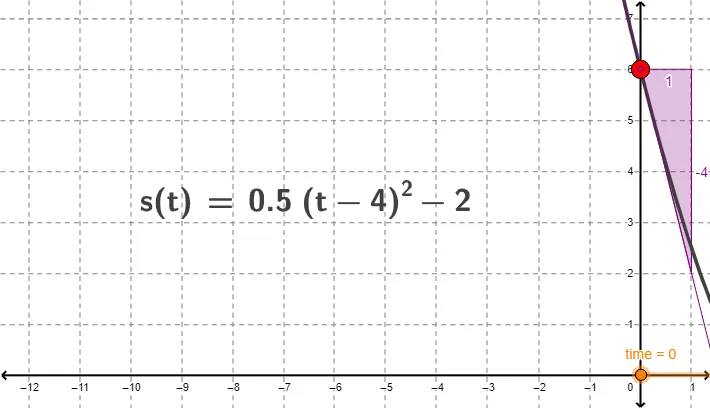
Animated balls illustrate the horizontal and or vertical displacement for a quadratic position function s(t). A tangent line is included so you can... This example demonstrates the graphical representation of horizontal or vertical displacement in a quadratic position function s(t). Key math concepts include vectors, tangent function, and function graphing. It is constructed using GeoGebra commands like LaTeX, Tangent, Slope with objects such as s, time, A, B, text1, C, a, m, text2. Suitable for high school or introductory college students learning kinematics and calculus.
GeoGebra Commands & Parameters
LaTeX(s, true, true) → text1Tangent(C, s) → aSlope(a) → mLaTeX(a, true, true) → text2
AI Drawing Prompt Reference
Create a 2D coordinate plane with time on the x-axis and displacement on the y-axis. Plot a quadratic curve representing position as a function of time. Place a moving point on the curve, and draw horizontal and vertical displacement vectors from the origin to that point as arrows. At the same point, draw a tangent line to the curve)Skip the tangent line and display its slope value numerically. Add text labels showing the position function and the tangent line equation. Keep the diagram clean and educational, emphasizing vector decomposition and the derivative concept.
The prompt above was compiled from the original drawing commands and is for reference only.