
Directional Derivative Visualization: Instantaneous Rate of Change Along Any Dir
Loading the math board and drawing, please wait…
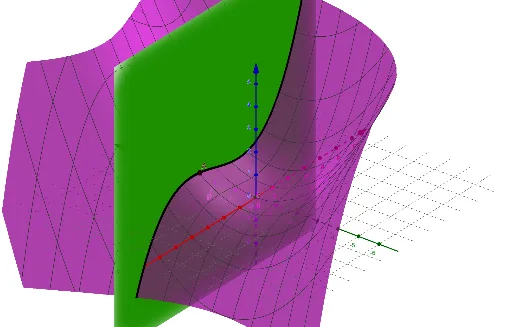
① This GeoGebra example dynamically demonstrates the directional derivative of a two-variable function at a point along an arbitrary direction, visually showing the slope of the tangent line on the surface in that direction. ② Core mathematical concepts include directional derivative, gradient, partial derivatives, tangent plane, and direction vectors, helping learners grasp the relationship between directional derivative and gradient in multivariable calculus. ③ Construction highlights: uses the CurveCartesian command to draw parametric curves on the surface, the Tangent command to construct tangent lines along a specified direction, and defines objects f, a, b, A, g, d, p, c, h; sliders or input fields adjust the direction angle, updating the tangent line and directional derivative value in real time. ④ Suitable for university-level calculus or multivariable function courses, as well as advanced high school mathematics or self-study, serving as a visual aid to clarify abstract concepts.
GeoGebra Commands & Parameters
CurveCartesian(t + a, (d * t) + b, f(t + a, (d * t) + b), t, -10, 10) → cTangent(A, c) → h
AI Drawing Prompt Reference
Create a 3D plot of a two-variable function’s surface, then visualize the directional derivative at a chosen point along an arbitrary direction. First, generate a parametric line through the point using a direction parameter, and map that line to the surface to form a parametric curve lying on the surface. Next, at the point on this curve, draw the tangent line whose orientation is determined by the chosen direction. Provide adjustable input (e.g., a direction angle) so the curve, tangent line, and the displayed directional-derivative value update in real time.
The prompt above was compiled from the original drawing commands and is for reference only.