
Exploring Extremes of Inequalities in Variables x and y
Loading the math board and drawing, please wait…
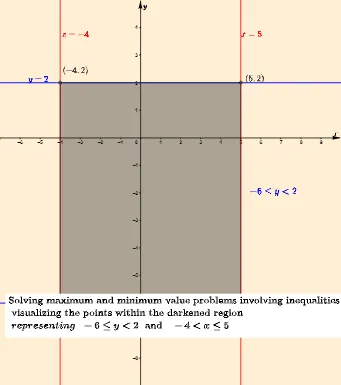
This self-directed learning tutorial uses GeoGebra to explore the extremes of inequalities involving variables x and y. Key mathematical concepts include inequalities, functions, and extrema. Commands used include Intersect, Polygon, Max, Min, and others. Suitable for high school mathematics education and learning.
GeoGebra Commands & Parameters
TextToUnicode(LaTeX[a]) → list_xTextToUnicode(LaTeX[b]) → list_yIntersect(g, eq1) → DIntersect(g, eq2) → CIntersect(f, eq2) → BIntersect(f, eq1) → APolygon(D, C, B, A) → q1, c, d, b_1, a_1Textfield(x_l) → InputBox1Textfield(x_u) → InputBox2Textfield(y_l) → InputBox3Textfield(y_u) → InputBox4Max(x_l, x_u) → max_xMin(x_l, x_u) → min_xMin(y_l, y_u) → min_yMax(y_l, y_u) → max_yMin({(min_x * min_y), (max_x * min_y), (max_y * min_x), (max_x * max_y)}) → ans_cIf(x_u > 0 ∧ x_l < 0 ∨ x_u ≟ 0 ∨ x_l ≟ 0, true, false) → minxsqzeroIf(y_u > 0 ∧ y_l < 0 ∨ y_u ≟ 0 ∨ y_l ≟ 0, true, false) → minysqzeroIf(minysqzero, {min_x / min_y, max_x / min_y, min_x / max_y, max_x / max_y, max_x / 0}, {min_x / min_y, max_x / min_y, min_x / max_y, max_x / max_y}) → listxdivyMax(listxdivy) → ans_dMin(y_l - 3, -3) → yscrminMax(y_u + 3, 3) → yscrmaxMin(x_l - 3, -3) → xscrminMax(x_u + 5, 5) → xscrmaxIf(minxsqzero, 0, Min[min_x^(2), max_x^(2)]) → minsqxMax(min_x^(2), max_x^(2)) → maxsqxIf(minysqzero, 0, Min[min_y^(2), max_y^(2)]) → minsqyMax(min_y^(2), max_y^(2)) → maxsqyMax(listysqminusx) → ans_eIf(minysqzero, {max_y^(2) / min_x, min_y^(2) / min_x, minsqy / min_x, max_y^(2) / max_x, min_y^(2) / max_x, minsqy / max_x}, {max_y^(2) / min_x, min_y^(2) / min_x, max_y^(2) / max_x, min_y^(2) / max_x}) → listysqdivxIf(minysqzero, {LaTeX["\frac{" + "(" + max_y + ")²" + "}{" + min_x + "}"], LaTeX["\frac{" + "(" + min_y + ")²" + "}{" + min_x + "}"], LaTeX["\frac{" + minsqy + "}{" + min_x + "}"], LaTeX["\frac{" + "(" + max_y + ")²" + "}{" + max_x + "}"], LaTeX["\frac{" + "(" + min_y + ")²" + "}{" + max_x + "}"], LaTeX[("\frac{" * minsqy) + "}{" + max_x + "}"]}, {LaTeX["\frac{" + "(" + max_y + ")²" + "}{" + min_x + "}"], LaTeX["\frac{" + "(" + min_y + ")²" + "}{" + min_x + "}"], LaTeX["\frac{" + "(" + max_y + ")²" + "}{" + max_x + "}"], LaTeX["\frac{" + "(" + min_y + ")²" + "}{" + max_x + "}"]}) → listtxtysqdivxMin(listysqdivx) → ans_fIf(IsInRegion[A, ylessthanx] ∧ IsInRegion[C, ylessthanx] ∨ IsInRegion[A, ygreaterthanx] ∧ IsInRegion[C, ygreaterthanx], true, false) → sqyminusxnotzeroSegment(A, C) → iIf(Defined[Intersect[i, h]], Intersect[i, h], (99, 99)) → EIf(sqyminusxnotzero, {(max_y - max_x)^(2), (max_y - min_x)^(2), (min_y - max_x)^(2), (min_y - min_x)^(2)}, {floor(y(E)) - floor(x(E)), (max_y - max_x)^(2), (max_y - min_x)^(2), (min_y - max_x)^(2), (min_y - min_x)^(2)}) → listsqofyminusxMin(listsqofyminusx) → ans_gIf(sqyminusxnotzero, {LaTeX["((" + max_y + ")-(" + max_x + "))²"], LaTeX["((" + max_y + ")-(" + min_x + "))²"], LaTeX["((" + min_y + ")-(" + max_x + "))²"], LaTeX["((" + min_y + ")-(" + min_x + "))²"]}, {LaTeX["((" + (floor(y(E))) + ")-(" + (floor(x(E))) + "))^2"], LaTeX["((" + max_y + ")-(" + max_x + "))²"], LaTeX["((" + max_y + ")-(" + min_x + "))²"], LaTeX["((" + min_y + ")-(" + max_x + "))²"], LaTeX["((" + min_y + ")-(" + min_x + "))²"]}) → listtxtsqofyminusxMin(listyminusxcubed) → ans_hIf(¬minysqzero, {min_x^(2) - min_y^(2), max_x^(2) - min_y^(2), min_x^(2) - max_y^(2), max_x^(2) - max_y^(2)}, {min_x^(2) - 0, max_x^(2) - 0}) → listxsqminusysqMax(listxsqminusysq) → ans_iIf(¬minysqzero, {LaTeX["(" + min_x + ")^2-(" + min_y + ")^2"], LaTeX["(" + max_x + ")^2-(" + min_y + ")^2"], LaTeX["(" + min_x + ")^2-(" + max_y + ")^2"], LaTeX["(" + max_x + ")^2-(" + max_y + ")^2"]}, {LaTeX[("(" * min_x) + ")²" + "-(" + 0 + ")^2"], LaTeX[("(" * max_x) + ")²" + "-(" + 0 + ")^2"]}) → listtxtxsqminusysqMin(listxcubedminusysq) → ans_jIf(minxsqzero, {LaTeX["\frac{" + min_y + "}{2(^-" + 0 + ")}"], LaTeX["\frac{" + max_y + "}{2(^-" + 0 + ")}"], LaTeX["\frac{" + max_y + "}{2(" + 0 + "^+)}"], LaTeX["\frac{" + min_y + "}{2(" + 0 + "^+)}"], LaTeX["\frac{" + min_y + "}{2(" + min_x + ")}"], LaTeX["\frac{" + max_y + "}{2(" + min_x + ")}"], LaTeX["\frac{" + min_y + "}{2(" + max_x + ")}"], LaTeX["\frac{" + max_y + "}{2(" + max_x + ")}"]}, {LaTeX["\frac{" + min_y + "}{2(" + min_x + ")}"], LaTeX["\frac{" + max_y + "}{2(" + min_x + ")}"], LaTeX["\frac{" + min_y + "}{2(" + max_x + ")}"], LaTeX["\frac{" + max_y + "}{2(" + max_x + ")}"]}) → listtxtydiv2xIf(minxsqzero, {((-min_y)) / 0, ((-max_y)) / 0, max_y / 0, min_y / 0, min_y / ((2 * min_x)), max_y / ((2 * min_x)), min_y / ((2 * max_x)), max_y / ((2 * max_x))}, {min_y / ((2 * min_x)), max_y / ((2 * min_x)), min_y / ((2 * max_x)), max_y / ((2 * max_x))}) → listydiv2xMax(listydiv2x) → ans_k
AI Drawing Prompt Reference
Create a mathematical illustration showing the extremes of inequalities involving variables x and y. Start by plotting two function curves and finding their intersection points. Connect these points to form a quadrilateral. Then, based on user-defined minimum and maximum values for x and y, determine a display area and plot the functions within it. Finally, calculate and display some extrema and derived values related to the graph.
The prompt above was compiled from the original drawing commands and is for reference only.