
Exploring Averages, Box Plots and Outliers
Loading the math board and drawing, please wait…
In collections
Resources for New A-level Maths Spec
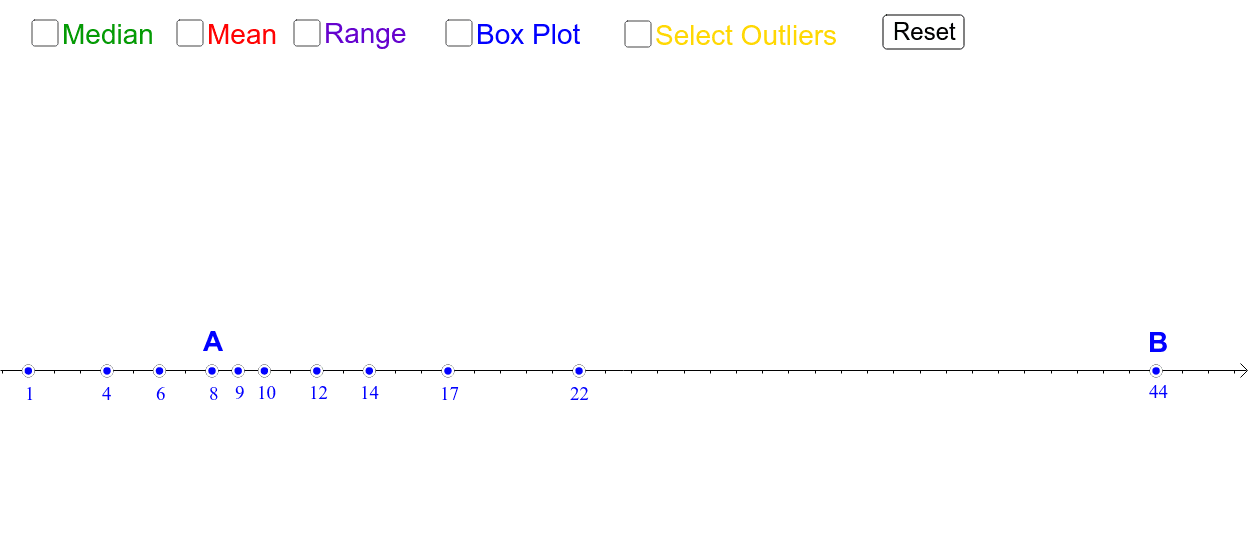
① This interactive GeoGebra example demonstrates how moving data points and selecting outliers affect measures of central tendency and the shape of box plots. ② Core mathematical concepts include mean, median, quartiles, box-and-whisker plots, and the influence of outliers on statistical summaries. ③ Construction highlights: using GeoGebra commands such as Point, Sequence, Segment, BoxPlot, RemoveUndefined, LineBisector, Intersect, OrthogonalLine, and Mean; data are stored in lists (list1, list2, etc.) and a matrix (matrix1), with text objects (text2, text3, etc.) displaying computed statistics. ④ Suitable for high school or introductory college statistics courses, this example helps students explore data distributions, understand how outliers skew averages, and interpret box plot variations.
GeoGebra Commands & Parameters
Point(xAxis) → KPoint(xAxis) → JPoint(xAxis) → IPoint(xAxis) → HPoint(xAxis) → BPoint(xAxis) → CPoint(xAxis) → DPoint(xAxis) → EPoint(xAxis) → FPoint(xAxis) → GPoint(xAxis) → ASequence((If[Element[matrix1, 2, i] ≟ 0, Element[matrix1, 1, i]], 0), i, 1, 11) → list1Sequence((If[Element[matrix1, 2, i] ≟ 1, Element[matrix1, 1, i]], 0), i, 1, 11) → list2RemoveUndefined(list1) → list3RemoveUndefined(list2) → list4Segment((Min[x(list3)], 3), (Max[x(list3)], 3)) → mBoxPlot(3, 0.25, x(list3)) → rSequence((Element[list5, i], 3), i, 1, Length[list4]) → list6LineBisector(m) → iIntersect(i, m) → LOrthogonalLine(Median, xAxis) → pOrthogonalLine(Mean, xAxis) → qIntersect(q, xAxis) → MIntersect(p, xAxis) → NSegment(Median, N) → sSegment(Mean, M) → t
AI Drawing Prompt Reference
Draw 11 points on the horizontal axis and generate two lists based on matrix data, one containing elements with value 0 and the other with value 1. Remove undefined items from the lists, create a horizontal line segment using the minimum and maximum x-values. Plot a box-and-whisker plot based on the list data. Calculate the median and mean, draw vertical lines intersecting the horizontal axis, and connect the median and mean intersection points with line segments to show the relationship between data distribution and statistics.
The prompt above was compiled from the original drawing commands and is for reference only.