
Explore the Sine Function
Loading the math board and drawing, please wait…
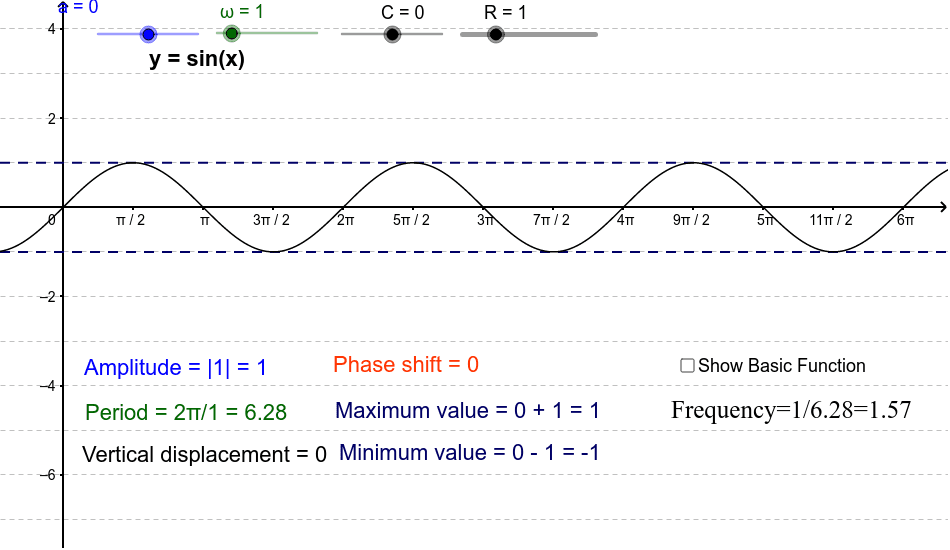
This example demonstrates the sine function's graph and its properties, covering core concepts like sine wave, periodicity, amplitude, phase, and coordinate geometry. It uses GeoGebra commands such as Intersect with objects like R, C, ω, g, end, a, valley, f, B, C_1, D, A, E, e, peak, h_M, y_m, F, G, H, h, g_1, I, J, p, T1, b, text1, T3, T2, T5, T4, T6, T7 for construction. Suitable for high school mathematics teaching and function graph exploration.
GeoGebra Commands & Parameters
Intersect(f, h_M, (18831364.023917638, 1.7499999993458946)) → FIntersect(f, h_M, (-7764624.248692612, 1.7499999998759117)) → GIntersect(f, y_m, (-26118917.5131709, -1.7499999987552242)) → HIntersect(h_M, h, (4315594.83266204, 1)) → IIntersect(h_M, h, (51173504.83608541, 1)) → J
AI Drawing Prompt Reference
Draw the sine function graph to demonstrate its periodicity, amplitude, and phase. Start by drawing the sine curve, then add the horizontal line y_m and the y-axis. Find the intersection points H of the sine curve with the line y_m. Draw the unit circle h_M on the y-axis and find its intersection points F and G with the sine curve. Finally, mark the intersection points I and J of the sine curve with the y-axis.
The prompt above was compiled from the original drawing commands and is for reference only.