
Explore the effects of a and b on linear graph y = ax + b
Loading the math board and drawing, please wait…
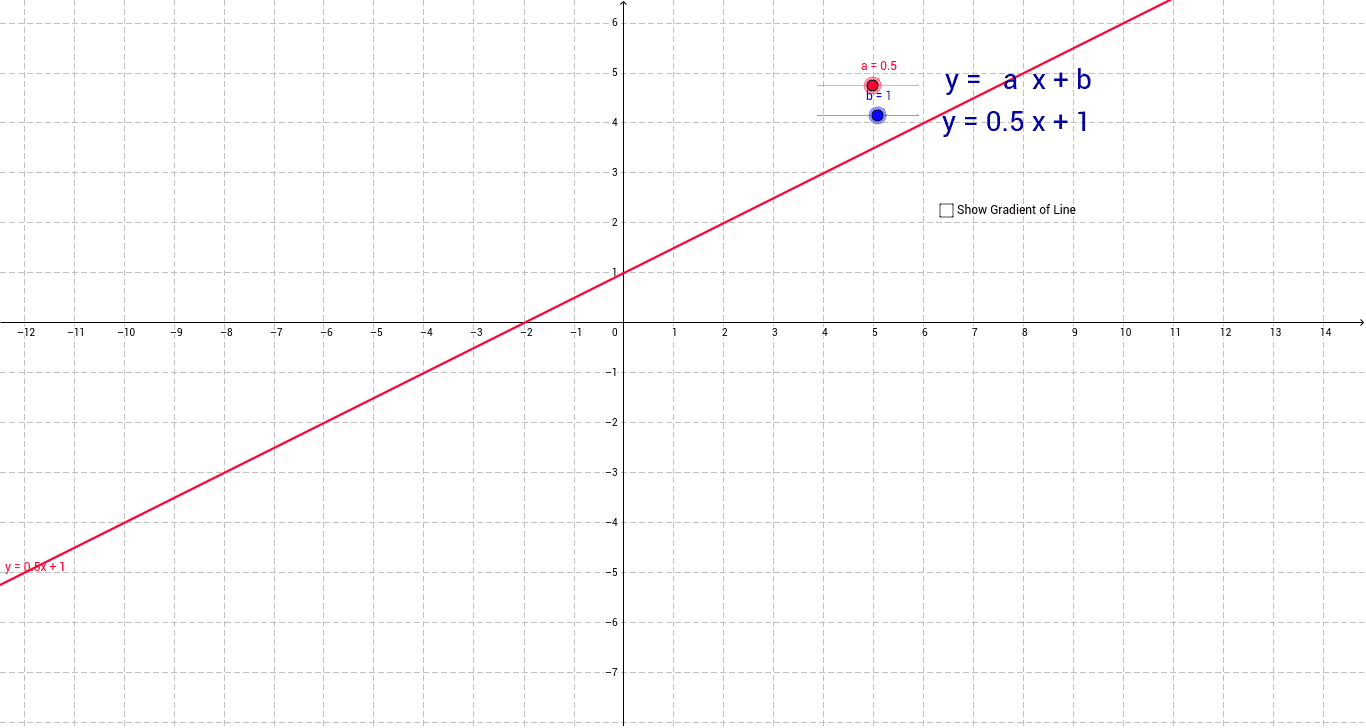
This example demonstrates the effects of parameters a and b on the linear graph y = ax + b. It involves core math concepts like linear functions, slope, y-intercept, and analytical geometry. The construction uses GeoGebra commands/objects such as sliders a, b, c, texts text2, text1, text3, and object d. Suitable for high school students learning about function transformations and the impact of parameters on function properties.
GeoGebra Commands & Parameters
Numeric a(0.5)Numeric b(1.0)y = a * x + bBoolean d(false)
AI Drawing Prompt Reference
Draw a straight line with equation y = a x + b, where a and b are adjustable parameters. Show the line on a coordinate plane with axes and grid. Add two sliders to control the values of a and b, initially set to a = 0.5 and b = 1. Include a toggle switch to show or hide an auxiliary object. The line should change its slope and intercept dynamically as the sliders are moved.
The prompt above was compiled from the original drawing commands and is for reference only.