
Explore Table-Formula-Graph Relationships
Loading the math board and drawing, please wait…
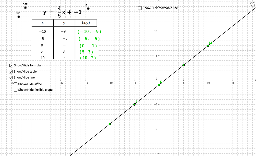
Play with this applet to learn the relationships between the table, formula, and graph. This example involves multiple representations of function graphs and uses commands like Point, Vector, Line, Intersect, etc. Suitable for high school and above students or teachers.
GeoGebra Commands & Parameters
Point(a) → APoint(a) → BVector(A, (x(A), y(B))) → uVector((x(A), y(B)), B) → vPoint(u) → CPoint(v) → DPoint(a) → EVector(E, (x(E), y(E) + rise)) → wVector((x(E), y(E) + rise), (x(E) + run, y(E) + rise)) → zPoint(w) → GPoint(z) → HCircle(N, circleradius) → gLine(N, xAxis) → hIntersect(g, h, 2) → OPoint(yAxis) → QMirror(P, Q) → RLine(P, R) → j