
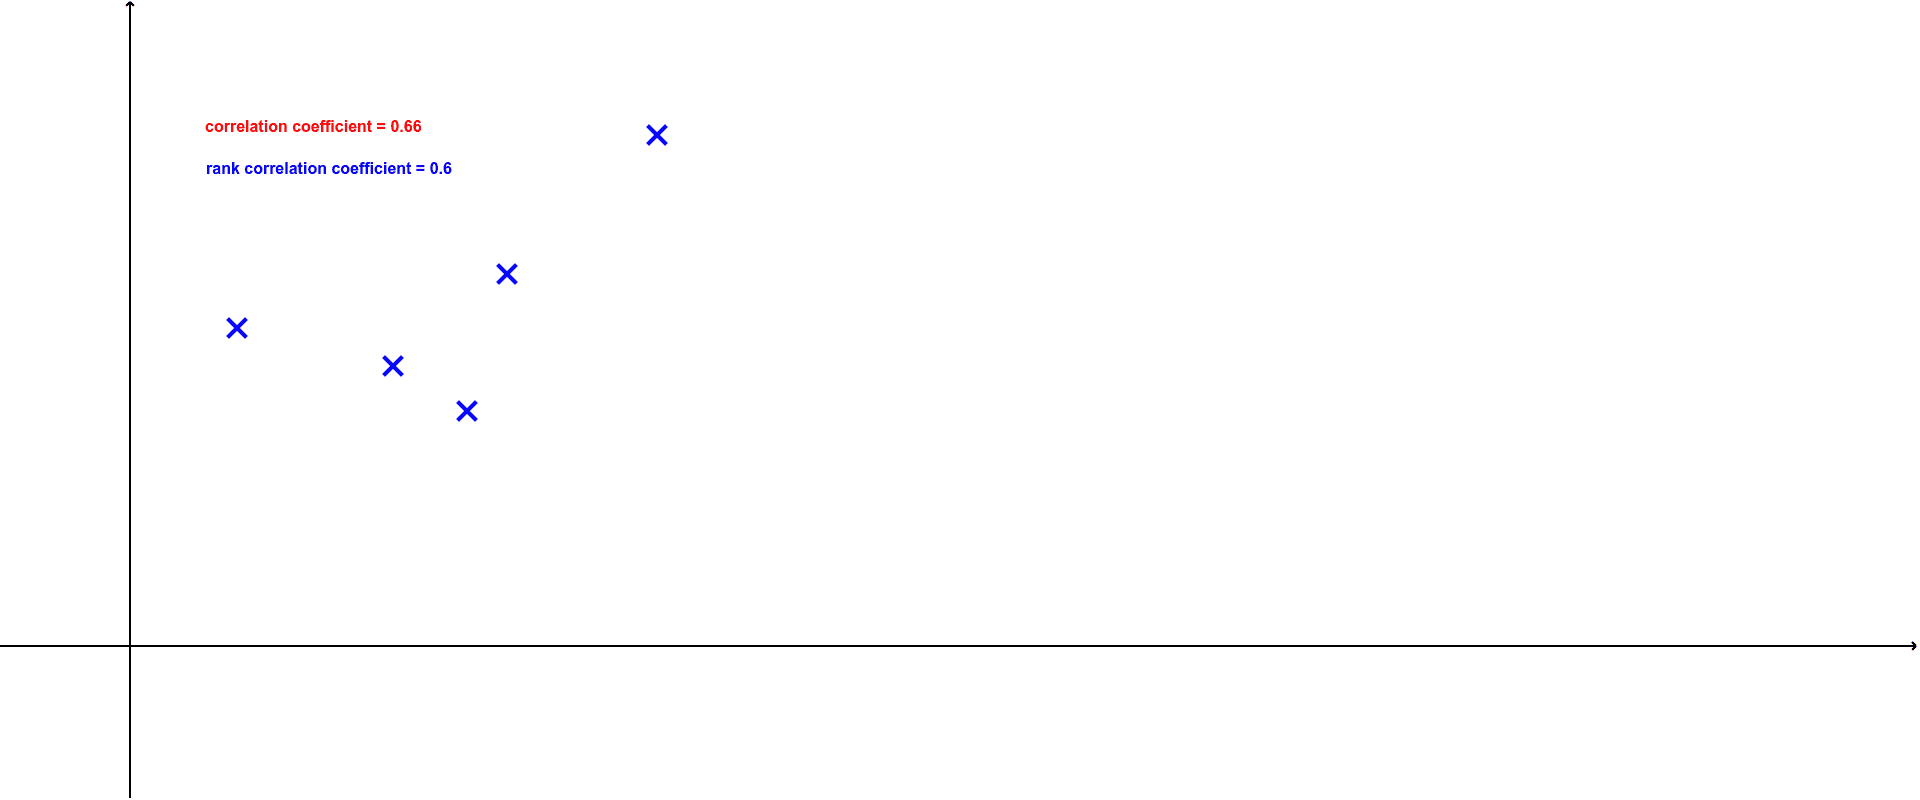
Explore Rank Correlation
Loading the math board and drawing, please wait…
In collections
statistics
This example explores rank correlation. By analyzing the rank order of two variables, it helps understand their non-linear relationship. Key mathematical concepts include Spearman's rank correlation coefficient and Pearson's correlation coefficient. Construction highlights include using GeoGebra commands Spearman and PMCC to analyze data, and creating data lists and slider animations to dynamically show changes in correlation. Suitable for high school and above students or teachers to understand non-linear correlation analysis.
GeoGebra Commands & Parameters
Spearman(list1) → aPMCC(list1) → b
AI Drawing Prompt Reference
Create a scatter plot of two variables, and use slider animations to dynamically change the data points to observe and analyze their Spearman rank correlation coefficient and Pearson correlation coefficient, understanding their non-linear relationship. First, create two data lists, then calculate and display the coefficients after adjusting the data points with slider animations.
The prompt above was compiled from the original drawing commands and is for reference only.